
Opis
⚠️ Przenieśliśmy się do 👉 PrimeQuant
🚫🚫🚫 Nie kupuj tego wskaźnika!
🎯 Przegląd
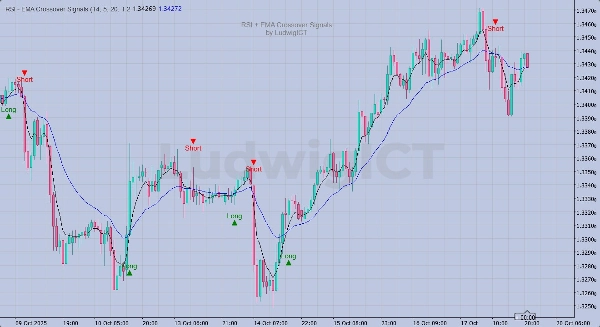
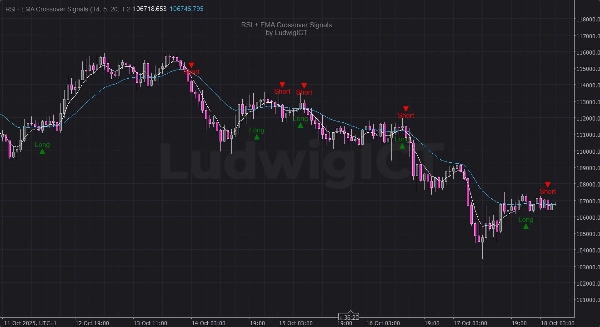
Wskaźnik RSI + EMA Crossover Signals autorstwa LudwigICT łączy momentum oraz potwierdzenie trendu, aby generować sygnały handlowe o wysokim poziomie pewności — bezpośrednio na Twoim wykresie.
⚙️ Jak to działa:
- Etap sygnału RSI:
-
- Sygnał jest uzbrajany, gdy RSI przecina swoją własną linię sygnału SMA.
- Etap potwierdzenia EMA:
-
- Sygnał jest wyzwalany tylko wtedy, gdy szybkie i wolne EMA przecinają się w tym samym kierunku.
- Anulowanie sygnału:
-
- Każde przeciwny crossover (RSI lub EMA) anuluje nieaktywowany sygnał.
✨ Kluczowe cechy:
- 🔁 Podwójna logika potwierdzenia (RSI + EMA)
- 📈 Wyraźne ikony Long i Short wyświetlane bezpośrednio na wykresie
- ⚡ Dynamiczne przesunięcia wizualne oparte na ATR (automatyczne dostosowanie do zmienności)
- 💧 Czysta nakładka z trwałym znakiem wodnym
- 🧠 Inteligentna logika „uzbrajania” i „anulowania” w celu redukcji fałszywych sygnałów
- 🧮 W pełni regulowane parametry RSI, EMA i przesunięcia
🔧 Wejścia:
- Okres RSI (domyślnie: 14)
- Szybka EMA (domyślnie: 5)
- Wolna EMA (domyślnie: 20)
- Przesunięcie sygnału (mnożnik ATR, domyślnie: 1.2)
📊 Idealne dla:
- Traderów momentum
- Systemów potwierdzania trendu
- Ręcznych lub półautomatycznych strategii handlowych
📅 Aktualizacje wersji:
- ✅ Dodano dynamiczne przesunięcie oparte na ATR dla lepszej wizualizacji
- ✅ Ulepszona logika dokładności sygnału
- ✅ Dodano nieusuwalny znak wodny dla autentyczności
© 2025 LudwigICT — Wszelkie prawa zastrzeżone.
Jeśli masz jakiekolwiek pytania lub napotkasz problemy, śmiało skontaktuj się ze mną. Chętnie pomogę!
Zastrzeżenie:
Korzystając z moich algorytmów, przyjmujesz do wiadomości, że handel wiąże się z ryzykiem i że wyniki historyczne nie gwarantują przyszłych rezultatów. Niezbędne jest posiadanie solidnej strategii zarządzania ryzykiem i, co najważniejsze, dyscypliny w przestrzeganiu poziomów stop-loss. Nieprawidłowe zarządzanie ryzykiem może prowadzić do znacznych strat. Nie ponoszę odpowiedzialności za jakiekolwiek skutki finansowe wynikające z używania tych algorytmów. Handluj odpowiedzialnie i zawsze stosuj właściwe praktyki zarządzania ryzykiem.
Błogosławieństwo! 🙌
Podsumowanie
Opinie klientów
5 | 0 % | |
4 | 100 % | |
3 | 0 % | |
2 | 0 % | |
1 | 0 % |


