
Opis
Przenieśliśmy się do 👉 PrimeQuant
🚫🚫🚫 Nie kupuj tego wskaźnika!
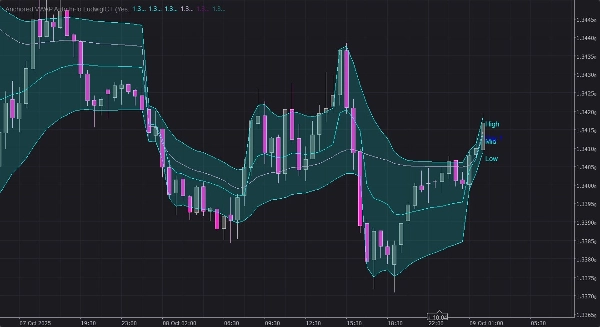
1. Zakotwiczony VWAP - maksimum i minimum
- Śledzi dwie oddzielne linie zakotwiczonego VWAP:
-
- Kotwica maksimum → VWAP zaczynający się od najnowszego punktu „przebicia maksimum”.
- Kotwica minimum → VWAP zaczynający się od najnowszego punktu „przebicia minimum”.
- Kotwice resetują się, gdy:
-
- Cena przebija powyżej poprzedniego zakotwiczonego maksimum (dla kotwicy maksimum) lub poniżej poprzedniego zakotwiczonego minimum (dla kotwicy minimum).
- Lub po określonej liczbie sesji (np. 1 dzień), jeśli SessionLimited jest włączone.
- Opcjonalnie, reset następuje tylko w określonych godzinach rynku.
- Może również pokazywać Linię Środkową = średnia z zakotwiczonych VWAP maksimum i minimum.
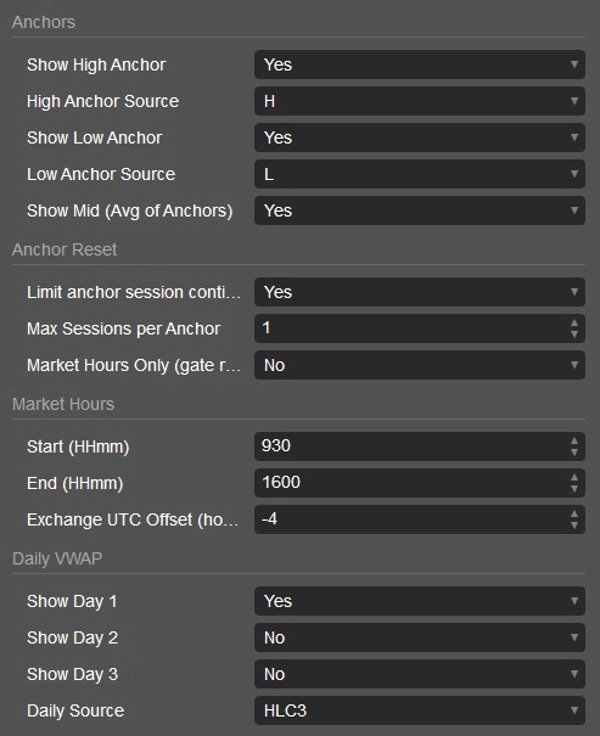
2. Kontrola sesji i godzin rynku
- SessionLimited: Ogranicza czas trwania kotwicy przez sesje (dni handlowe).
- AnchorMaxSessions: Maksymalna liczba sesji przed automatycznym resetem.
- MarketHoursOnly: Zapobiega resetom poza wybranymi godzinami rozpoczęcia/zakończenia (np. RTH dla akcji).
- ExchangeUtcOffsetHours: Dostosowuje godziny rynku do wybranej giełdy.
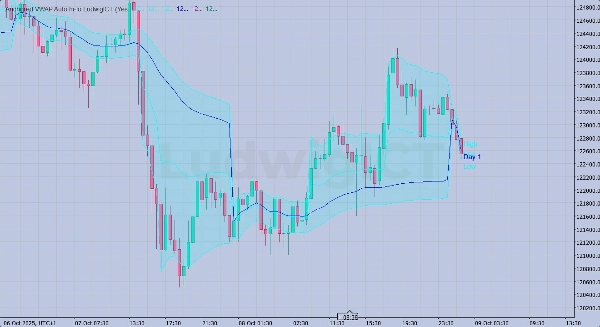
3. Codzienny VWAP za ostatnie 3 dni
- Śledzi codzienny VWAP dla:
-
- Dzień 1 (dzisiaj)
- Dzień 2 (wczoraj)
- Dzień 3 (przedwczoraj)
- Wszystkie te poziomy można wyświetlić razem, aby zobaczyć krótkoterminowe poziomy VWAP.
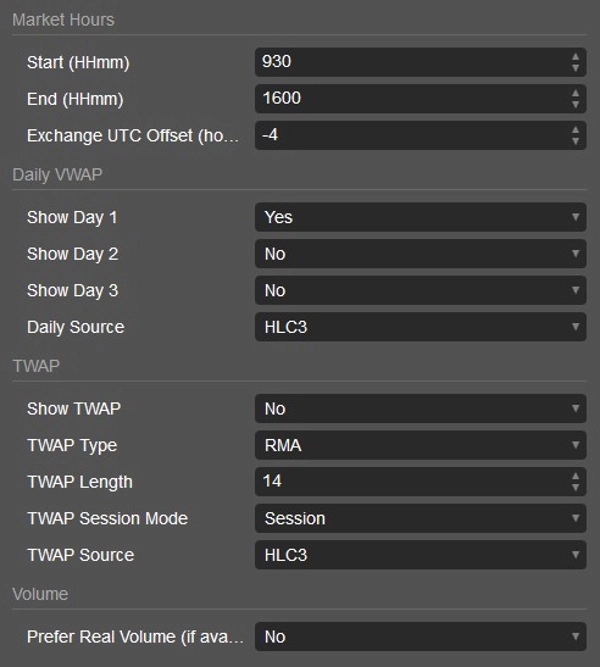
4. TWAP (Średnia ważona czasem)
- Opcjonalna linia pokazująca TWAP oparty na różnych metodach średnich kroczących:
-
- SMA, EMA, RMA, WMA, VWMA lub regresja liniowa.
- Może resetować się każdą sesję (tryb sesji) lub działać ciągle (tryb nieprzerwany).
- Długość jest regulowana, a typ ceny źródłowej wybieralny.
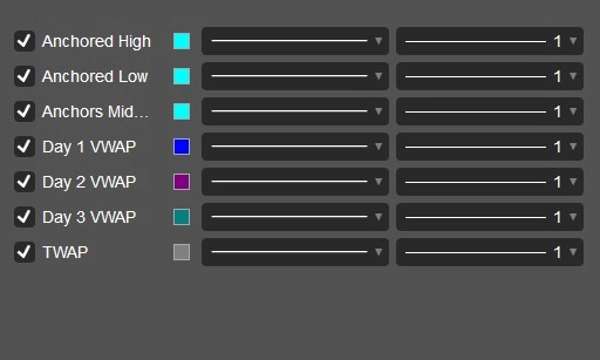
5. Wizualne wyjścia
- Rysuje linie dla:
-
- Zakotwiczony VWAP maksimum
- Zakotwiczony VWAP minimum
- Zakotwiczona linia środkowa
- VWAP dni 1, 2, 3
- TWAP
- Rysuje także etykiety na ostatnim słupku pokazujące, która linia jest która.
6. Obsługa wolumenu
- Domyślnie używa wolumenu tickowego (standard cTrader).
- Może preferować rzeczywisty wolumen, jeśli jest dostępny.
💡 W terminologii tradingowej:
Ten wskaźnik służy głównie do śledzenia zakotwiczonych poziomów VWAP z kluczowych punktów zwrotnych (najnowsze maksima/minima), jednocześnie monitorując krótkoterminową historię VWAP i opcjonalnie nakładając TWAP. Został zaprojektowany dla traderów, którzy chcą precyzyjnego śledzenia VWAP opartego na sesjach z zasadami resetu podobnymi do oryginalnej wersji Pine, ale z ulepszeniami dotyczącymi ograniczeń godzin rynku i wieloma odniesieniami VWAP/TWAP.
Jeśli masz jakiekolwiek pytania lub napotkasz problemy, śmiało skontaktuj się ze mną. Chętnie pomogę!
Zastrzeżenie:
Korzystając z moich algorytmów, przyjmujesz do wiadomości, że handel wiąże się z ryzykiem, a wyniki historyczne nie gwarantują rezultatów w przyszłości. Niezbędne jest posiadanie solidnej strategii zarządzania ryzykiem i przede wszystkim dyscypliny w przestrzeganiu poziomów stop-loss. Nieprawidłowe zarządzanie ryzykiem może prowadzić do znacznych strat. Nie ponoszę odpowiedzialności za jakiekolwiek skutki finansowe wynikające z użycia tych algorytmów. Handluj odpowiedzialnie i zawsze stosuj właściwe praktyki zarządzania ryzykiem.
Błogosławieństwa! 🙌
Podsumowanie
The indicator also displays a Midline, calculated as the average of the high and low anchored VWAPs, and tracks daily VWAP levels for the last three days to provide short-term VWAP history. Additionally, it offers an optional Time-Weighted Average Price (TWAP) line, which can be calculated using various moving average methods (SMA, EMA, RMA, WMA, VWMA, or Linear Regression) and configured to reset each session or run continuously.
Session and market hours controls include options to limit anchor duration across sessions, set maximum sessions before reset, restrict resets to market hours, and adjust for exchange time zones. The indicator uses tick volume by default but can be set to prefer real volume if available. Visual outputs include labeled lines for anchored high, low, midline VWAPs, daily VWAPs, and TWAP, aiding traders in precise session-based VWAP analysis with enhanced reset and market-hour features.
Opinie klientów
5 | 67 % | |
4 | 33 % | |
3 | 0 % | |
2 | 0 % | |
1 | 0 % |


