คำอธิบาย
โครงสร้างช่วงเปิดในทุกช่วงเวลา—ตั้งแต่ช่วงเวลาภายในวันจนถึงรอบปี—พร้อมระดับฟีโบนัชชีและการคาดการณ์การขยายตัว
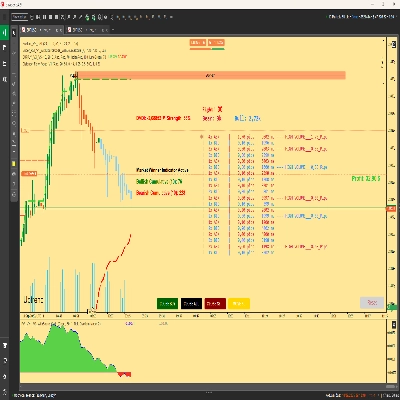
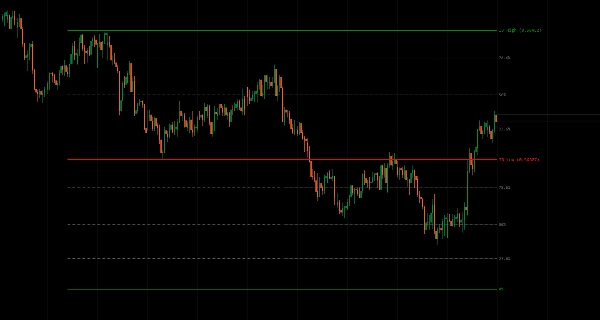
ทำเครื่องหมายช่วงสูง/ต่ำที่กำหนดขึ้นในช่วงเปิด (รายวัน รายสัปดาห์ รายเดือน รายไตรมาส รายปี หรือช่วงกำหนดเอง) เป็นข้อมูลอ้างอิงสำหรับการเบรกเอาต์ การกลับสู่ค่าเฉลี่ย และความคาดหวังความผันผวน
มีประเภทช่วงเวลาแปดประเภทพร้อมการตรวจจับช่วงเวลาที่รับรู้โซนเวลา (ซิดนีย์/โตเกียว/ลอนดอน/นิวยอร์ก) การเลื่อนประวัติศาสตร์สำหรับการเปรียบเทียบหลายช่วงเวลา ตัวเลือกเจ็ดระดับฟีโบนัชชี (11.4% ถึง 88.6%) ภายในช่วง IB การคาดการณ์ขึ้น/ลงจากขอบเขต การควบคุมการขยายเส้นที่ยืดหยุ่น (เฉพาะช่วง IB, แท่งปัจจุบัน หรือ N ช่วงเวลาข้างหน้า) และการตรวจจับช่วงเวลาที่แม่นยำ มอบการวิเคราะห์ช่วงเปิดที่ครอบคลุมสำหรับผู้ซื้อขายที่มุ่งเน้นการตั้งค่าตามโครงสร้างในทุกกรอบเวลา
คุณสมบัติ
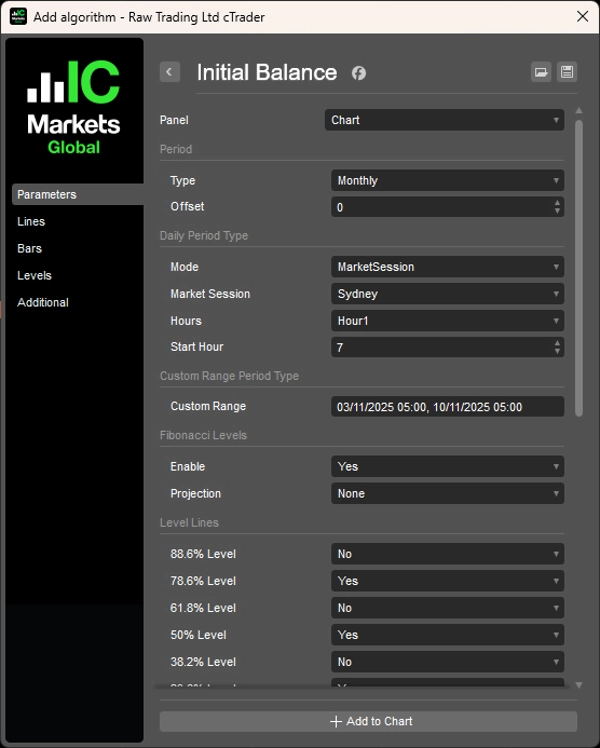
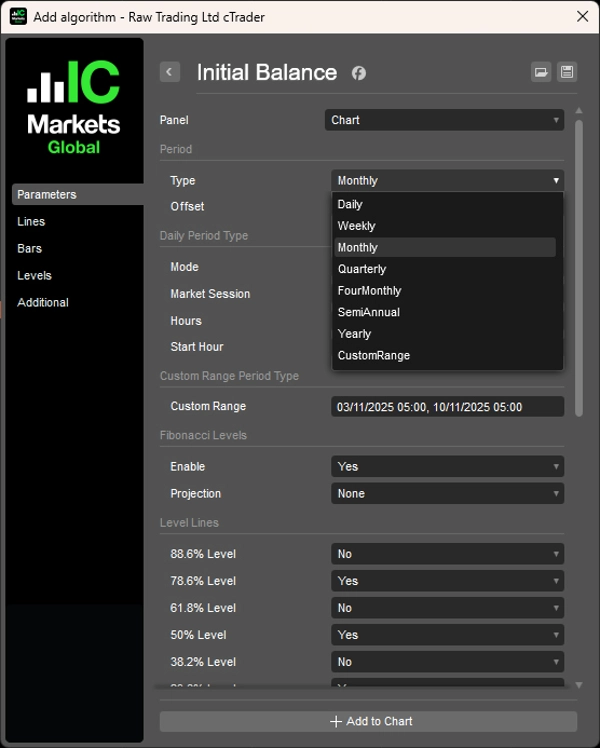
8 ประเภทช่วงเวลา
- รายวัน รายสัปดาห์ รายเดือน รายไตรมาส 4 เดือน ครึ่งปี รายปี ช่วงกำหนดเอง
- โหมดรายวัน: ตามชั่วโมง (1-12 ชั่วโมง) หรือช่วงเวลาตลาด (ซิดนีย์/โตเกียว/ลอนดอน/นิวยอร์ก)
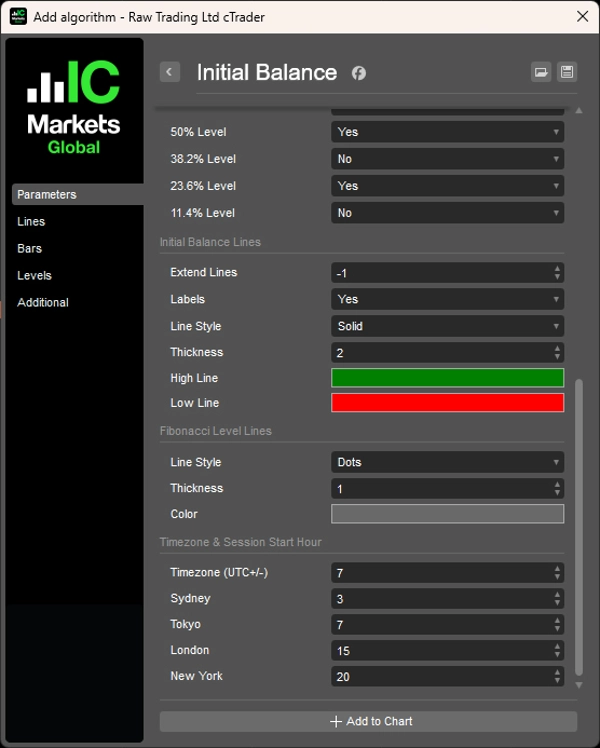
- กำหนดเวลาการเริ่มต้นช่วงได้พร้อมการปรับเลื่อน UTC ที่รับรู้โซนเวลา
- ช่วงกำหนดเอง: กำหนดวันและเวลาที่เริ่มต้น/สิ้นสุดสำหรับการวิเคราะห์เหตุการณ์
ช่วงเวลาประวัติศาสตร์
- พารามิเตอร์เลื่อนเพื่อดูช่วง IB ในอดีต (เช่น IB ของสัปดาห์ที่แล้ว, IB ของเดือนที่แล้ว)
- เปรียบเทียบการเคลื่อนไหวราคาปัจจุบันกับโครงสร้างช่วงเวลาก่อนหน้า
- การวิเคราะห์หลายช่วงเวลาเพื่อยืนยันแนวโน้ม
ระดับฟีโบนัชชี
- ตัวเลือก 7 ระดับ (11.4%, 23.6%, 38.2%, 50%, 61.8%, 78.6%, 88.6%) ภายในช่วง IB
- โซนกลับสู่ค่าเฉลี่ยภายในสมดุล
- จุดอ้างอิงเข้าหรือออกที่แม่นยำ
การคาดการณ์ฟีโบนัชชี
- คาดการณ์ระดับขึ้น/ลงจากสูง/ต่ำของ IB
- เป้าหมายเบรกเอาต์ที่อาจเกิดขึ้นนอกช่วง
- โซนขยายสำหรับการเคลื่อนไหวตามทิศทาง
การควบคุมการขยายเส้น
- เฉพาะช่วง IB: แสดงช่วงในช่วงเวลาการก่อตัว
- แท่งปัจจุบัน: ขยายไปจนถึงปัจจุบัน
- N ช่วงเวลาข้างหน้า: คาดการณ์ไปข้างหน้าเพื่อการวางแผน
- การจัดการภาพที่สะอาดตา
การตรวจจับช่วงเวลาที่แม่นยำ
- การคำนวณช่วงเปิดที่แม่นยำสำหรับแต่ละประเภทช่วงเวลา
- รับรู้โซนเวลาสำหรับตลาดทั่วโลก
- จัดการการทับซ้อนและการเปลี่ยนช่วงเวลาได้อย่างเรียบร้อย
__________________________________________________________________________________________
ตัวชี้วัดฟรีเพิ่มเติม
สำรวจเครื่องมือวิเคราะห์ตลาดหลากหลายประเภท—ตั้งแต่โครงสร้างและปริมาณไปจนถึงการถดถอย ความผันผวน และกรอบเวลาที่กำหนดเอง
ซอร์สโค้ดมีให้บน GitHub repository.
ทั้งหมดใช้ฟรี แต่ถ้าคุณต้องการสนับสนุนด้วยกาแฟ คุณสามารถส่งได้ ที่นี่.
แนวรับ/แนวต้าน
ปริมาณ
- Volume Activity Profiler
- Volume Efficiency Analyzer
- Volume Profile Analytics
- Volume Profile - Updated
- Volume Spread Analysis
- VWAP (Volume Weighted Average Price)
ค่าเฉลี่ยเคลื่อนที่
- SSL Channel
- Anchored Moving Average
- Deviation-Scaled Moving Average
- Gann High Low Activator
- Instantaneous Trendline
- Kaufman Adaptive MA with Trend Vision
- Moving Average Channel
- Moving Averages Suite
- Trend Channel Moving Average
ยูทิลิตี้/กำหนดเอง
แบบถดถอย
ความผันผวน
ออสซิลเลเตอร์
__________________________________________________________________________________________
ข้อจำกัดความรับผิดชอบ
การซื้อขายมีความเสี่ยง ตัวชี้วัดนี้มีไว้สำหรับการวิเคราะห์ทางเทคนิคเท่านั้น — โปรดใช้การจัดการความเสี่ยงที่เหมาะสมและซื้อขายอย่างรับผิดชอบเสมอ
ความคิดเห็น & การปรับปรุง
หากคุณมีข้อเสนอแนะ คำขอคุณสมบัติ หรือไอเดียสำหรับการปรับปรุง โปรดแสดงความคิดเห็นในแท็บ Discussion ความคิดเห็นของคุณช่วยปรับปรุงตัวชี้วัดสำหรับทุกคน
สรุป
Key features include configurable session start times with UTC offset adjustments, historical offset parameters for comparing past initial balance ranges, and multi-period analysis for trend confirmation. It offers optional Fibonacci retracement levels (11.4% to 88.6%) within the initial balance range to highlight mean reversion zones and precise entry or exit points. Additionally, Fibonacci projections extend upward or downward from the initial balance boundaries to indicate potential breakout targets and directional extension zones.
Line extension controls allow users to display the range during its formation, extend it to the current bar, or project it forward for planning purposes. The indicator ensures precise period detection, handling session overlaps and transitions accurately for global market analysis. This tool aids traders in identifying breakout, mean reversion, and volatility expectations based on opening range structures across all timeframes.
รีวิวจากลูกค้า
5 | 50 % | |
4 | 50 % | |
3 | 0 % | |
2 | 0 % | |
1 | 0 % |