
present
Zarejestruj się i otrzymaj 50 $ zniżki na pierwszy zakup
Trading product for WeTrades Trend Rider EMA Wskaźnik EMA Moving Average, image 1
WeTrades Trend Rider EMA
Wskaźnik
79 pobrania
Wersja 1.0, May 2026
Windows, Mac
Trading product for WeTrades Trend Rider EMA Wskaźnik EMA Moving Average, image 2
Trading product for WeTrades Trend Rider EMA Wskaźnik EMA Moving Average, image 3
Trading product for WeTrades Trend Rider EMA Wskaźnik EMA Moving Average, image 4
Trading product for WeTrades Trend Rider EMA Wskaźnik EMA Moving Average, image 5
Trading product for WeTrades Trend Rider EMA Wskaźnik EMA Moving Average, image 6
Trading product for WeTrades Trend Rider EMA Wskaźnik EMA Moving Average, image 7
3.6K
Bezpłatne instalacje

Opis

WeTrades Trend Rider EMA – Stworzony, aby unikać fałszywych ruchów

Jako trader złota, jednym z największych problemów, z jakimi się spotkałem, było wpadać w pułapkę fałszywych byczych świec podczas trendu spadkowego.

Cena nagle tworzyła silne zielone świece, wyglądające jak odwrócenie, a ja wchodziłem zbyt wcześnie — tylko po to, by obserwować, jak główny trend idzie przeciwko mnie.

Właśnie dlatego stworzyłem WeTrades Trend Rider EMA.

Ten wskaźnik został zaprojektowany, aby utrzymać Cię skupionym na prawdziwym trendzie, a nie na tymczasowym szumie rynkowym.

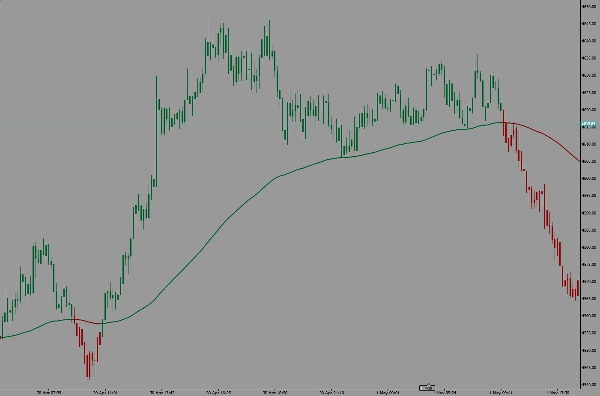
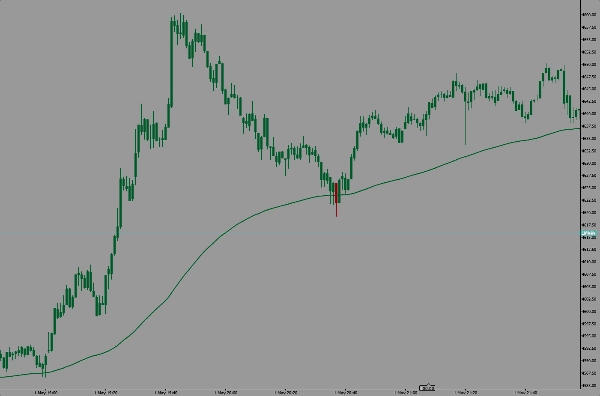
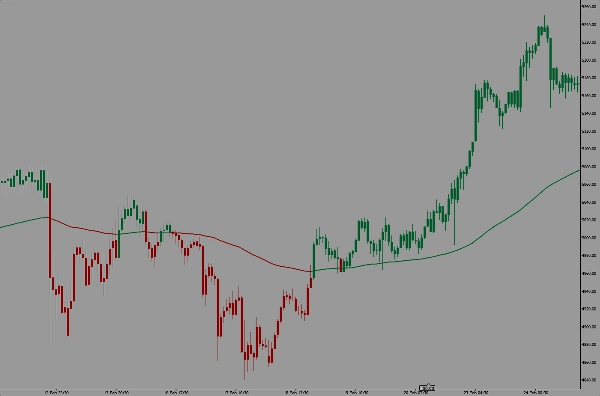
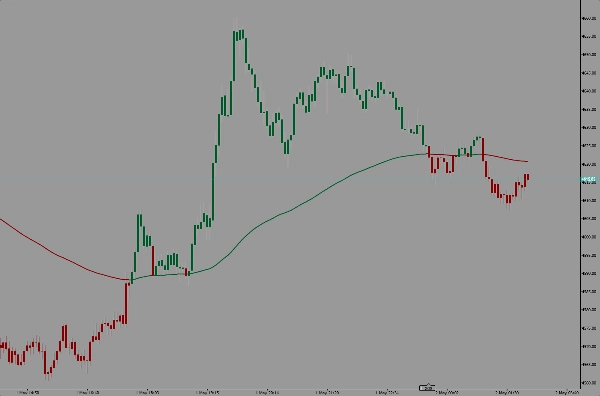
Używa wykładniczej średniej kroczącej (EMA) jako filtra trendu i koloruje świece w zależności od tego, gdzie cena zamyka się względem EMA.

Jak to działa

  • Jeśli cena zamyka się powyżej EMA → świece stają się bycze
  • Jeśli cena zamyka się poniżej EMA → świece stają się niedźwiedzie
  • Linia EMA zmienia się według tej samej logiki dla czystego potwierdzenia trendu

Cel jest prosty:

Nie handluj każdą świecą. Handluj trendem.

Bycza świeca w trendzie spadkowym często może być tylko korektą — a nie odwróceniem.

Ten wskaźnik pomaga szybciej rozpoznać tę różnicę.

Dlaczego go używam

Na rynku złota fałszywe ruchy zdarzają się szybko.
Silne świece mogą wprowadzać traderów w błąd, sugerując zmianę momentum.

Dzięki Trend Rider EMA mogę szybko zobaczyć:

✔ Czy to prawdziwa zmiana trendu?
✔ Czy to tylko korekta?
✔ Czy handluję z momentum, czy przeciwko niemu?

Najlepszy dla

  • Traderów złota
  • Skalperów
  • Traderów intraday
  • Traderów podążających za trendem

Moja zasada handlowa

Zielone świece powyżej EMA = siła byków
Czerwone świece poniżej EMA = siła niedźwiedzi

Proste wizualne potwierdzenie.
Mniej wahania.
Mniej fałszywych sygnałów.
Lepsza dyscyplina trendu.

Stworzony na podstawie prawdziwego doświadczenia handlowego.
Stworzony dla traderów, którzy chcą czytelniejszego odczytu trendu i mniej złych wejść.

Podsumowanie

Podsumowanie AI
WeTrades Trend Rider EMA is a trading indicator designed to enhance trend identification by filtering out false market moves. It uses an Exponential Moving Average (EMA) as a trend filter and colors price candles based on their closing position relative to the EMA. Candles closing above the EMA are colored bullish, while those closing below are bearish. The EMA line itself adjusts accordingly to confirm trend direction visually.

This indicator aims to help traders focus on genuine trend shifts rather than temporary pullbacks or fake reversals, reducing premature entries against the main trend. It is particularly suited for gold traders, scalpers, intraday traders, and those employing trend-following strategies.

Key features include:
- Visual color-coded candles indicating bullish or bearish momentum relative to the EMA.
- EMA line that dynamically confirms trend direction.
- Simplified trend discipline by distinguishing real trend strength from market noise.

By providing clear visual cues, WeTrades Trend Rider EMA assists traders in making more informed decisions about trading with momentum and avoiding false signals.

Profil wskaźnika
Kategoria wskaźnika
Trend
Typ wyjścia
Wizualizacja
Wymagania dotyczące danych
Tylko słupki
Obsługiwane sygnały
Przełamanie
Odwrócenie trendu
Siła trendu
Przebicie poziomu
Dotknięcie poziomu

Opinie klientów

0.0
Opinie: 0
Opinie klientów
Ten produkt nie ma jeszcze opinii. Wypróbowałeś(-aś) go już? Bądź pierwszy(-a) i powiedz o tym innym!

Dyskusja

Częste pytania

EMA
Moving Average
Produkty dostępne za pośrednictwem cTrader Store, w tym boty handlowe, wskaźniki i wtyczki, dostarczane są przez deweloperów zewnętrznych i udostępniane wyłącznie w celach informacyjnych oraz w celu zapewnienia dostępu technicznego. cTrader Store nie jest brokerem i nie zapewnia doradztwa inwestycyjnego, nie udziela spersonalizowanych rekomendacji ani nie gwarantuje przyszłych wyników.

Więcej od tego autora

Wskaźnik
SMC
Prop
+14
Fair Value Gap (FVG)
Wskaźnik
ATR
Prop
+15
Smart trendline breakout indicator with auto signals, targets, and ATR-based zones for precise trade execution.
Wskaźnik
AI
SMC
+18
Smart Money Concepts (SMC)
Wskaźnik
MSS
Key Levels
+2
Marks liquidity zones at swing highs/lows, tracks touches, and confirms breaks to improve entries and structure clarity.
Wskaźnik
ATR
MSS
+5
Volume-based support and resistance boxes with breakout, hold, and structure shift signals for precise trading decisions
Wskaźnik
BOS
MSS
+3
identify Market Structure Breaks and Order Blocks to trade with confidence and avoid fake breakouts.
Wskaźnik
ATR
RSI
+15
Identifies high-probability breakout and retest zones using smart pivot structure and volatility filtering.
Wskaźnik
AI
SMC
+18
ICT First Presented FVG
Wskaźnik
SMC
Prop
+13
Smart Money traders, it extends key levels until mitigation, helping you track liquidity, structure
Wskaźnik
MSS
Key Levels
+4
Auto-detects support/resistance, draws clean levels, and confirms breakouts with volume and wick rejection signals.
Wskaźnik
ATR
BOS
+5
Smart SMC + Fibonacci engine with ATR filtering, dynamic levels, and precision entry signals.
cBot
Fixed Lot
Break Even
+2
Fast trade manager with hotkeys for break-even, partial closes, and instant exit control.

Możesz także polubić

Wskaźnik
Grid
Prop
+14
Visualize trends with Standard Deviation Channel! Display median, and add customizable upper/lower deviation channels.
Wskaźnik
Smart Signal Reversal Trend + Patterns
Wskaźnik
ATR
Fibonacci
+1
Trading Clock Pro: An all-in-one market timing dashboard designed to help traders understand the market at one Spot.
Wskaźnik
Key Levels
Order Block
+5
Pixel-perfect trading zones in a click! Instantly draw, resize & color via hotkeys. Automate your charting routine
Wskaźnik
ATR
RSI
+5
Supply and demand zones with break of structure, higher timeframe MA signals, a percent stop and three targets.
Wskaźnik
ATR
EMA
+4
Range-filter BUY/SELL signals scored by four confluence layers, with a stop, five targets and a trend panel
Logo „IVB 2.0”
Najwyżej oceniane
4.6
(5)
$19
Wskaźnik
IVB 2.0 is an indicator that works on the strategy of imbalance of the maximum volatility box of indices
Wskaźnik
MACD
Prop
+14
Customize the MACD! Choose colors, get real-time tick updates, and see crossover points for enhanced trading precision.
Wskaźnik
AI
ATR
+26
Session Volume Profile + Composite. POC/VAH/VAL, Focus/Solo. Fast, clean, no ghosts, live-ready.
Wskaźnik
ADX
ATR
+5
EMA-cross signals scored on six confluence layers, with an ATR stop, three targets and a live panel
Wskaźnik
RSI
Indices
Stochastic RSI (StochRSI) is a technical indicator used to measure the strength and weakness of the RSI.
Wskaźnik
Forex
NAS100
+3
volumen perfile
Logo „ATR Bands”
Popularne
4.7
(4)
$19
Wskaźnik
ATR
Prop
+13
Enhance trading with ATR Bands! Visualize market volatility using dynamic upper and lower ATR bands for precise decision
Wskaźnik
Market Sessions
Logo „FBX VWAP”
Najwyżej oceniane
4.5
(4)
$19
Wskaźnik
Prop
VWAP
+12
FBX VWAP Anchored — Professional VWAP
Wskaźnik
Prop
Forex
+7
The Parabolic SAR, or "Stop and Reverse," is a dynamic technical analysis tool.
Wskaźnik
AI
ATR
+26
The Triple Momentum indicator for cTrader is a versatile trend-following tool.
Wskaźnik
The KDJ oscillator display consists of 3 lines (K, D and J - hence the name of the display) and 2 levels.

Cena

3.6K
Bezpłatne instalacje