
คำอธิบาย
📈 ตัวบ่งชี้นี้เป็นเครื่องมือที่ช่วยให้เราระบุและมองเห็นทิศทางของแนวโน้มในแผนภูมิราคาได้ 📊 การทำงานของมันขึ้นอยู่กับการคำนวณระดับแนวโน้มโดยใช้ค่าเฉลี่ยเคลื่อนที่แบบทวีคูณและการวัดความผันผวนเพื่อกำหนดโซนที่คาดว่าราคาจะเคลื่อนไหว ด้านล่างนี้ ฉันจะอธิบายอย่างละเอียดว่ามันทำงานอย่างไร:
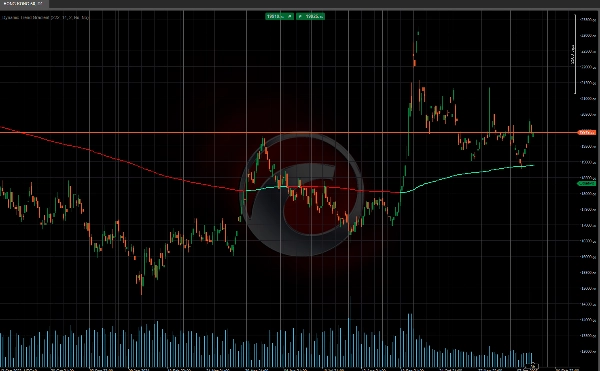
📐 การคำนวณระดับแนวโน้ม
ตัวบ่งชี้เริ่มต้นด้วยการคำนวณสิ่งที่เรียกว่า "ระดับฐาน" ระดับนี้ได้มาจากการเฉลี่ยค่าเฉลี่ยเคลื่อนที่แบบทวีคูณสองค่า: หนึ่งค่าเป็นระยะสั้น (ขึ้นอยู่กับความยาวที่ผู้ใช้กำหนด ในกรณีนี้คือ 222) และอีกค่าหนึ่งเป็นระยะยาว (สองเท่าของความยาวแรก) ค่าเฉลี่ยเหล่านี้ให้เราเป็นจุดอ้างอิงสำหรับแนวโน้มโดยรวม
ถัดไป จะคำนวณความผันผวนโดยใช้ส่วนเบี่ยงเบนมาตรฐานของราคาปิด และค่านี้จะถูกปรับให้เรียบด้วยค่าเฉลี่ยเคลื่อนที่แบบทวีคูณเพิ่มเติม ความผันผวนที่ปรับเรียบนี้จะถูกคูณด้วยพารามิเตอร์ที่เรียกว่า "ความไว" ซึ่งให้ระดับบนและล่างรอบระดับฐาน ระดับเหล่านี้ทำหน้าที่เป็นแถบแนวโน้มและช่วยระบุว่าราคาสูงกว่าหรือต่ำกว่าแนวโน้มหรือไม่
📉📈 สถานะแนวโน้ม
ด้วยระดับเหล่านี้ที่คำนวณได้ ตัวบ่งชี้จะประเมินสถานะแนวโน้มในตลาด หากราคาสูงกว่าระดับฐาน มันจะถือว่าเป็น แนวโน้มขาขึ้น 🐂 และถ้าต่ำกว่า แนวโน้มจะเป็น แนวโน้มขาลง 🐻 หากราคาตัดผ่านระดับบนหรือล่าง ตัวบ่งชี้จะเปลี่ยนสัญญาณแนวโน้มของมัน บ่งชี้ถึงการกลับตัวหรือการเปลี่ยนแปลงในโมเมนตัมของตลาด
เครื่องมือนี้เหมาะสำหรับเทรดเดอร์ที่ต้องการก้าวนำหน้าตลาด! 🚀📉📈
ตัวบ่งชี้ในร้านค้า Ctrader:
Dynamic Market Structure
Analysis of Turning Points
Fibonacci Linear
Regression Multi-timeframe
Multi-Level Candle Bias
Tracker
Auto Support and
Resistance Trend Lines
สรุป
รีวิวจากลูกค้า
5 | 0 % | |
4 | 100 % | |
3 | 0 % | |
2 | 0 % | |
1 | 0 % |


