
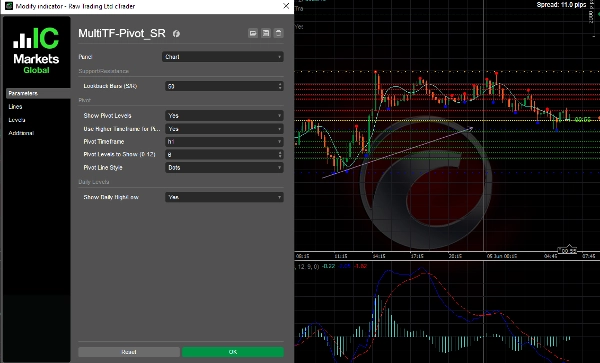
MultiTF-Pivot_SR
지표
2 구매
버전 1.0, May 2025
Windows, Mac
4.5
리뷰: 2
설명
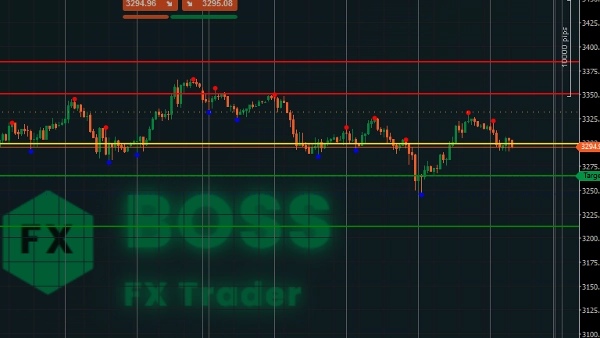
MultiTF_Pivot_SR V2 - 결합된 지지 및 저항 + 피벗 포인트 지표 for cTrader that works on any time frame.
이 지표가 거래에 유용한 이유는 무엇인가요?
✅ 특징:
버전 2 출시.
이 지표에 대한 업그레이드가 추가되었습니다.
- 일일 최고가 및 최저가 자동 감지 (매개변수 옵션 사용 가능 Y/N).
- 표시할 피벗 레벨 (최대 12개 계산 기반으로 구성 가능).
- 스타일로 선 표시 (사용자 선호도에 따라 구성 가능).
- 과거 바 지지 및 저항 (기본값 50은 계산에 기반하여 적절하며 사용자 선호도에 따라 구성 가능).
- 차트 위의 도형 그리기는 차단되지 않습니다.
이전 버전 1 출시.
- 이전 기간의 피벗 포인트(표준)를 계산합니다.
- 최근 스윙 고점/저점을 기반으로 지지 및 저항 구역을 감지합니다.
- 구성 가능한 모든 시간 프레임에 적응합니다.
- 피벗, 지지 및 저항 수준에 대한 선과 라벨을 표시합니다.
요약
지표 프로필
고객 리뷰
4.5
리뷰: 2
5 | 50 % | |
4 | 50 % | |
3 | 0 % | |
2 | 0 % | |
1 | 0 % |
고객 리뷰
June 5, 2025
June 3, 2025
The first thing that worked was the entry feels less rushed, and a small account test feels safer.
상담
자주 묻는 질문(FAQ)
트레이딩 봇, 지표, 플러그인 등 cTrader Store에서 제공되는 상품은 제3자 개발자에 의해 제공되며, 이는 단순히 정보 및 기술적 접근을 목적으로 제공된 것입니다. cTrader Store는 중개인이 아니며, 투자 조언, 개인별 추천 또는 향후 성과에 대한 어떠한 보장도 제공하지 않습니다.
이 작성자의 상품 더 보기


가격
가입일 29/05/2025
3.03M
거래량
45.22K
핍 수익
28
판매
749
무료 설치