
Area of Interest
Wskaźnik
2 zakupy
Wersja 1.0, Aug 2025
Windows, Mac
4.0
Opinie: 2
Od 29/05/2025
3.04M
Wolumen transakcji
45.22K
Zysk w pipsach
29
Sprzedaż
769
Bezpłatne instalacje
Opis
1. Cel wskaźnika
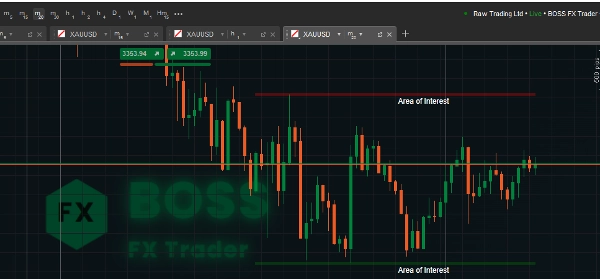
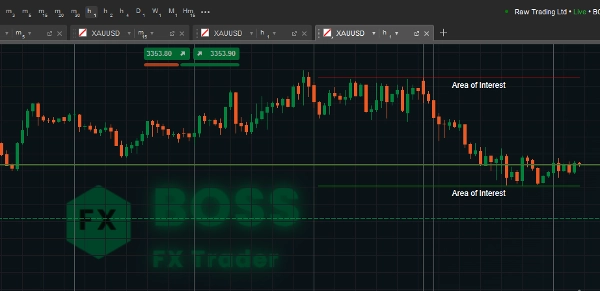
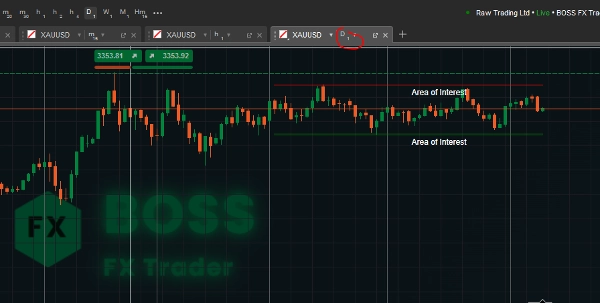
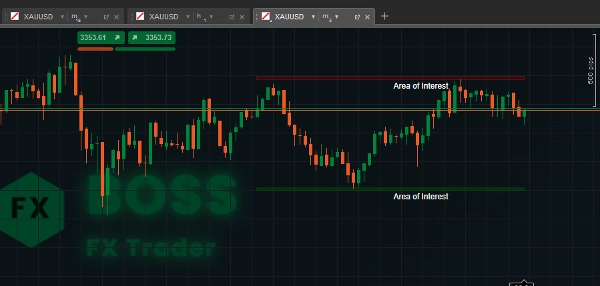
Ten wskaźnik Area of Interest dla cTrader identyfikuje strefy wsparcia i oporu w obrębie okresu wstecznego zdefiniowanego przez użytkownika i wizualnie podkreśla je jako „Obszary Zainteresowania” na Twoim wykresie.
Pomaga traderom szybko zobaczyć kluczowe poziomy cen, gdzie bardziej prawdopodobne są odwrócenia lub wybicia.
2. Jak działa kod
- Okres wsteczny – Liczba poprzednich słupków (świec), które wskaźnik przeskanuje, aby znaleźć najwyższy szczyt i najniższy dołek.
- Wyższe wartości → szersze strefy.
- Niższe wartości → bardziej aktualne poziomy.
- Wysokość strefy – Pionowy rozmiar (grubość) obszaru wsparcia/oporu w pipsach.
- Pomaga uczynić strefę bardziej widoczną i regulowaną.
- Czyści stare rysunki przed naniesieniem nowych, aby uniknąć bałaganu.
- Zbiera ceny maksymalne i minimalne dla zakresu wstecznego.
- Znajduje najwyższe i najniższe poziomy cen (opór i wsparcie).
- Konwertuje wysokość strefy z pipsów na rzeczywistą wartość cenową.
3. Instrukcje użytkowania
- Dołącz wskaźnik
-
- Otwórz cTrader, załaduj wykres, kliknij Indicators → Custom → AreaOfInterest.
- Dostosuj parametry
-
- Okres wsteczny:
-
- Dla swing tradingu → Używaj większych wartości (np. 100–200).
- Dla scalpingu → Używaj mniejszych wartości (np. 20–50).
- Wysokość strefy: Dostosuj do swojego stylu handlu i zmienności instrumentu.
- Interpretacja stref
-
- Czerwona strefa (opór) – Cena ma tendencję do odwracania się lub zwalniania po wejściu w tę strefę.
- Zielona strefa (wsparcie) – Cena często odbija się w górę z tego miejsca.
- Szukaj:
-
- Odrzucenia ceny
- Formacje świecowe (pin bary, objęcia)
- Zbieżność z innymi wskaźnikami (EMA, RSI, Fibonacci)
- Przykłady handlu
-
- Handel na odbiciu: Wejdź w pozycję długą blisko zielonej strefy ze stopem tuż poniżej niej.
- Handel na wybiciu: Poczekaj na zamknięcie cen powyżej czerwonej strefy dla byczego wybicia.
- Wykrywanie fałszywych wybicia: Obserwuj knoty poza strefą, ale zamknięcie wewnątrz (możliwe odwrócenia).
Ten narzędzie używał dochodowy trader.
Podsumowanie
Podsumowanie AI
Area of Interest is a cTrader indicator designed to identify and visually highlight key support and resistance zones on trading charts. It scans a user-defined lookback period to detect the highest highs and lowest lows, marking these as “Areas of Interest” to help traders recognize price levels where reversals or breakouts are more likely. Users can adjust the lookback period to focus on broader historical zones or more recent price levels, and set the vertical size (zone height) of these areas in pips for better visibility. The indicator clears previous drawings before plotting new zones to maintain chart clarity. Resistance zones are displayed in red, indicating potential price reversals or slowdowns, while support zones appear in green, suggesting possible price bounces. Traders can use these zones alongside price action signals such as candlestick patterns and other technical indicators to inform trading decisions. Typical applications include entering long positions near support zones, trading breakouts above resistance zones, and detecting false breakouts by observing price wicks relative to the zones. The indicator supports customization to suit different trading styles, including scalping and swing trading, by adjusting the lookback period and zone height parameters.
Profil wskaźnika
Opinie klientów
4.0
Opinie: 2
5 | 0 % | |
4 | 100 % | |
3 | 0 % | |
2 | 0 % | |
1 | 0 % |
Dyskusja
Częste pytania
Produkty dostępne za pośrednictwem cTrader Store, w tym boty handlowe, wskaźniki i wtyczki, dostarczane są przez deweloperów zewnętrznych i udostępniane wyłącznie w celach informacyjnych oraz w celu zapewnienia dostępu technicznego. cTrader Store nie jest brokerem i nie zapewnia doradztwa inwestycyjnego, nie udziela spersonalizowanych rekomendacji ani nie gwarantuje przyszłych wyników.


Cena
Od 29/05/2025
3.04M
Wolumen transakcji
45.22K
Zysk w pipsach
29
Sprzedaż
769
Bezpłatne instalacje