"VegaXLR - cTrader Pitchfork & Channel Enhancer" 로고
VegaXLR - cTrader Pitchfork & Channel Enhancer
"VegaXLR - cTrader Pitchfork & Channel Enhancer" 업로드된 이미지
186
판매
582
무료 설치

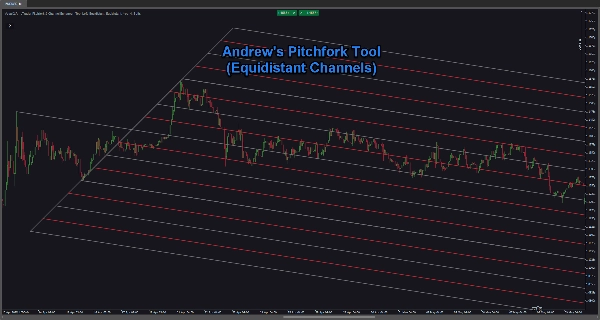
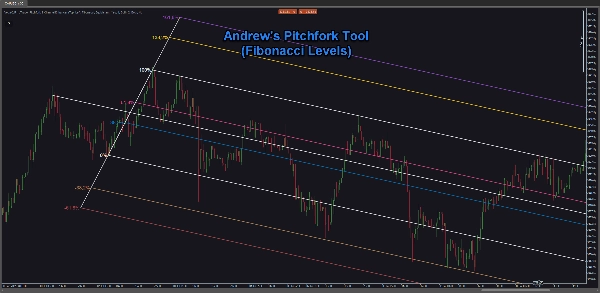
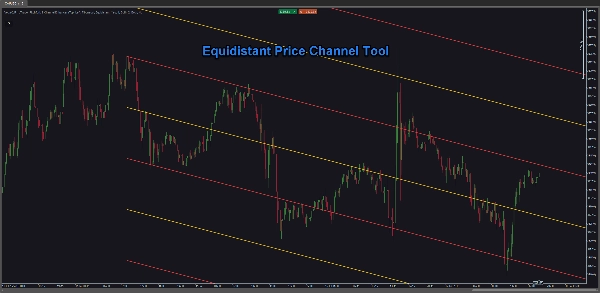
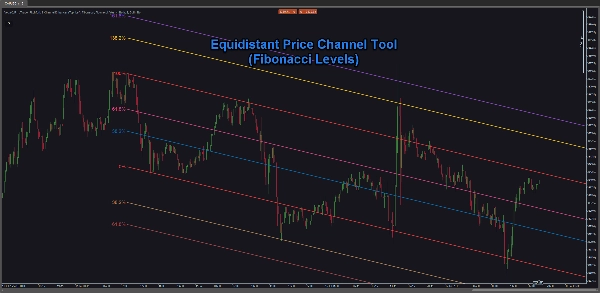
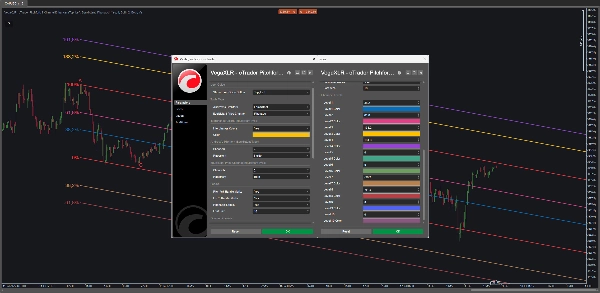
The cTrader Pitchfork & Channel Enhancer is an indicator designed to improve Andrew’s Pitchfork and Equidistant Price Channels in cTrader. It allows you to add customizable Fibonacci and Equidistant levels, create multiple channels, and adjust their placement with precision.


Features:

  • Add custom Equidistant or Fibonacci levels to your Pitchfork and Price Channels.
  • Use simple commands to quickly customize your chart objects.
  • Add labels and adjust colors for better chart organization.
  • Perfectly aligned lines every time.
  • User guide included.

This tool is perfect for traders looking to fine-tune their Pitchfork and Price Channels with advanced customization options. It simplifies the process of adding precise levels and multiple channels, letting you focus on analyzing market trends and making informed decisions.


Indicator profile
0.0
리뷰: 0
고객 리뷰
이 상품에 대한 리뷰가 아직 없습니다. 이미 사용해 보셨나요? 다른 사람들에게 가장 먼저 소개해 주세요!
Forex
Breakout
Indices
Crypto
Stocks
Products available through cTrader Store, including trading bots, indicators and plugins, are provided by third-party developers and made available for informational and technical access purposes only. cTrader Store is not a broker and does not provide investment advice, personal recommendations or any guarantee of future performance.

이 작성자의 상품 더 보기

Centralized access to VegaXLR's cBots, indicators, and educational content in cTrader.
Identify key support and resistance levels through detailed volume distribution analysis.
Free chart themes for the cTrader platform.
This is an indicator that can alert you about trendlines, horizontal lines and vertical lines.
Enhance your trading strategy with automated detection and alerts for key chart patterns.
A powerful cTrader indicator with customizable Moving Average alerts, notifications, and automated trading actions.
Automate lot sizing with cTrader Risk Manager cBot for precise risk management in pending and market orders.
VegaXLR's cTrader StochRSI identifies overbought/oversold RSI levels for precise trade entries.
Real-Time Candlestick Pattern Detection with Custom Alerts & Trend Analysis for cTrader
This is an advanced tool designed to protect your trading account by managing drawdown and run-up levels.
Customizable multi-timeframe pivot point indicator for cTrader with alerts, Fibonacci, CPR, and more!
cTrader ZigZag Alerts: Precision Swing Detection, Alerts, and Fibonacci.

좋아하실 만한 다른 항목

Pressure Scanner is a volatility-and-momentum to show both pressure states (squeeze on/off) and directional
Alpha Sentiment Pro - See the Market's Pulse Before It Moves
Follow The Trend cBot - INDICATOR - displays two Moving Average Bands for cBot or for your own use
Multi-pole Gaussian filter channel with dynamic color, Reduced Lag & Fast Response modes. Port of DonovanWall's original
Easy trend tool showing price zones and movement patterns with colour signals that change when trends shift direction.
The Trend Angle Indicator provides a clear and intuitive way to visualize market trends.
The Market Sessions indicator is a popular tool for visually representing global trading sessions on a price chart.
Displays previous sessions POC line.
Draws support and resistance on all pairs. https://ctrader.com/products/748?u=SuperRay
The Parabolic SAR, or "Stop and Reverse," is a dynamic technical analysis tool.
Visualize the four major trading sessions with color-coded rectangles showing session high/low ranges.
HTF POWER 3 ICT Power of 3 · M1 Precision · H4 Intelligence Auto-detect Accumulation → Manipulation → Distribution
Overlay a real-time higher-timeframe candle on your chart — color-coded bias without switching TFs.
Chart Explanation — Pivot High & Pivot Low Visualization and Dynamic Guidance
Percent Range Keys indicator
See USD demand in one line—Composite OBV fuses six major FX pairs into a clear momentum gauge.
Bottom & Top Finder V1.0
Microchannels
186
판매
582
무료 설치