
NewsGuard High-Impact News Risk Overlay
지표
2 구매
버전 1.0, Jan 2026
Windows, Mac
5.0
리뷰: 1
설명
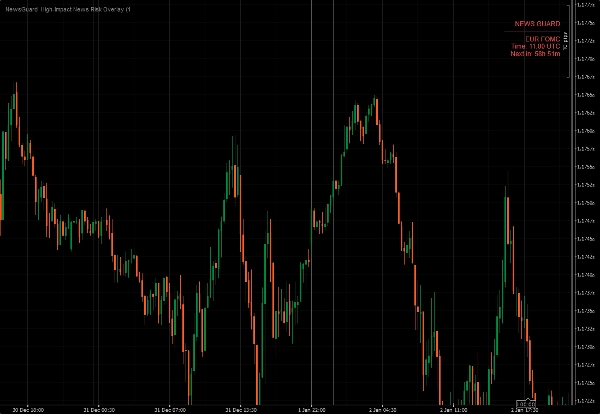
NewsGuard – 고영향 뉴스 위험 오버레이는 cTrader용 전문 위험 인식 도구입니다.
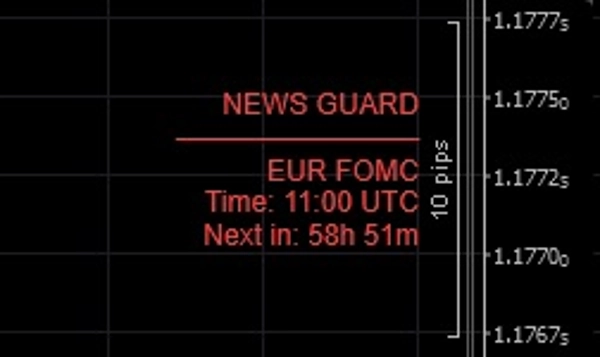
주요 경제 이벤트 주변의 시간 창을 시각적으로 강조하여 극심한 변동성, 스프레드 확장 및 슬리피지가 발생하는 것을 알려줍니다.
이동이 발생한 후에 반응하는 대신, NewsGuard는 위험이 증가하기 전에 경고합니다.
NewsGuard가 보여주는 것
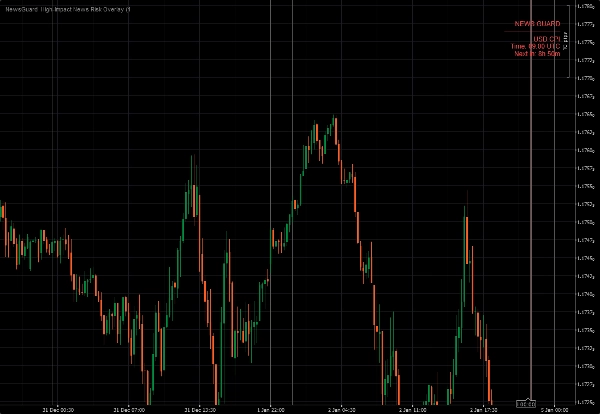
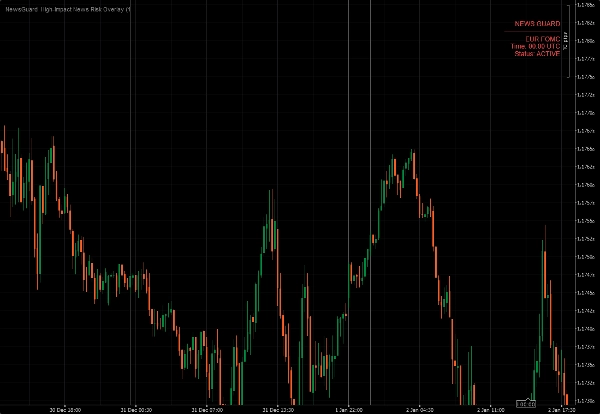
- 차트에 직접 표시되는 고영향 뉴스 위험 구역
- 각 이벤트 전후에 조절 가능한 시간 창
- 다가오는 또는 활성 뉴스 정보를 포함한 깔끔한 오버레이
- 거래 심볼을 기반으로 한 자동 관련성 필터링
NewsGuard는 수동 고영향 일정을 사용하여 다음과 같은 특징이 있습니다:
- 신뢰할 수 있음
- 스토어 안전
- 외부 피드 또는 API에 독립적임
NewsGuard가 아닌 것
- 뉴스 피드 없음
- 예측 없음
- 거래 신호 없음
단 하나의 목적을 위해 존재합니다:
시간 기반 위험을 인지하게 하는 것.
스캘퍼, 데이 트레이더, 그리고 주요 뉴스 이벤트에 무작정 거래하는 것을 피하고 싶은 모든 사람에게 완벽합니다.
요약
AI 요약
NewsGuard High-Impact News Risk Overlay is a risk-awareness indicator designed for the cTrader platform. It visually marks time windows around major economic events known to cause significant market volatility, spread widening, and slippage. The overlay displays high-impact news risk zones directly on trading charts, allowing traders to anticipate periods of increased risk before volatility occurs. Users can adjust the time windows before and after each event to suit their trading preferences. The tool automatically filters news relevance based on the traded symbol, providing a clean and focused overlay with upcoming or active news information. NewsGuard relies on a manually maintained high-impact news schedule, ensuring reliability and independence from external data feeds or APIs. It does not provide news feeds, forecasts, or trade signals; its sole purpose is to enhance trader awareness of time-based risk. This indicator is suitable for scalpers, day traders, and others who want to avoid entering trades blindly during major news events. Supported markets include Forex, indices, and popular symbols such as GBPUSD, XAUUSD (gold), and NAS100.
지표 프로필
고객 리뷰
5.0
리뷰: 1
5 | 100 % | |
4 | 0 % | |
3 | 0 % | |
2 | 0 % | |
1 | 0 % |
고객 리뷰
January 16, 2026
Poor entries are easier to skip, but the tool is just one part of the process.
상담
자주 묻는 질문(FAQ)
Forex
Breakout
Scalping
Indices
GBPUSD
XAUUSD
NAS100
트레이딩 봇, 지표, 플러그인 등 cTrader Store에서 제공되는 상품은 제3자 개발자에 의해 제공되며, 이는 단순히 정보 및 기술적 접근을 목적으로 제공된 것입니다. cTrader Store는 중개인이 아니며, 투자 조언, 개인별 추천 또는 향후 성과에 대한 어떠한 보장도 제공하지 않습니다.
이 작성자의 상품 더 보기


좋아하실 만한 다른 항목


!["[CB] Pivot Points Pro" 로고](https://cdn.ctrader.com/image/webp/43463c82-67b0-4f10-a4ba-901bba091d81_32594)


가격
가입일 02/01/2026
2
판매