
SpreadGuard Cost Spread Overlay
インジケーター
バージョン 1.0、Jan 2026
Windows、Mac
4.0
レビュー: 1
説明
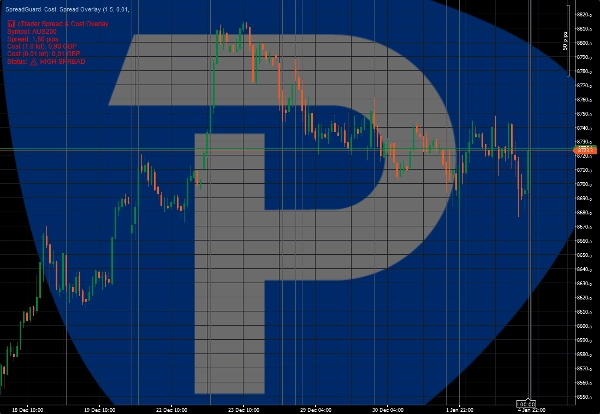
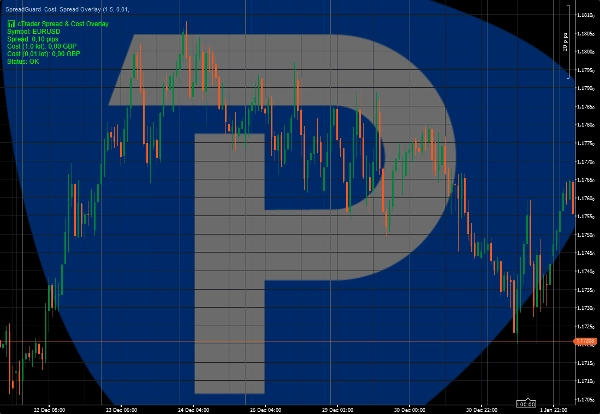
cTrader スプレッド&コストオーバーレイ は、チャート上でリアルタイムの取引コストを視覚化するために設計された軽量インジケーターです。
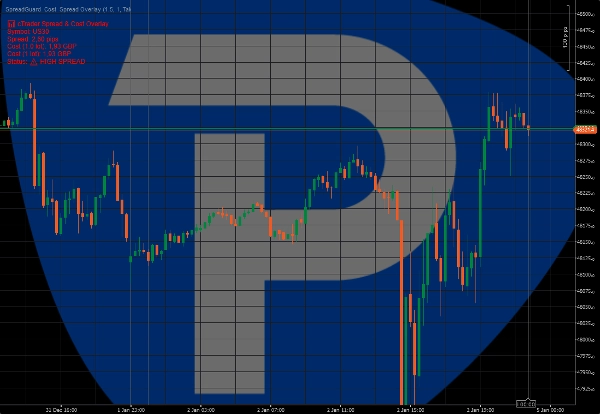
このインジケーターは現在のスプレッドをピップ単位で表示し、選択したロットサイズに基づいて取引の推定コストを計算します。視覚的な警告によりスプレッドが高い期間を強調表示し、トレーダーが不利な約定条件を避けるのに役立ちます。
主な特徴:
• ライブスプレッド表示(ピップ)
• 選択したロットサイズの推定取引コスト
• スプレッドが定義された閾値を超えた場合の視覚的警告
• クリーンなチャート上オーバーレイ
このインジケーターは取引を行ったり、取引シグナルを生成したりしません。
手動トレーダーのための約定およびリスク認識ツールとして意図されています。
スキャルパー、日中取引トレーダー、およびプロップファームアカウントに適しています。
*早期アクセス価格。将来のアップデートは通常価格より高くなる可能性があります。
概要
インジケーターのプロフィール
カスタマーレビュー
4.0
レビュー: 1
5 | 0 % | |
4 | 100 % | |
3 | 0 % | |
2 | 0 % | |
1 | 0 % |
カスタマーレビュー
January 16, 2026
Tbh it is not magic, just a decent extra filter. It should not be treated as the full answer.
ディスカッション
よくあるご質問
Prop
Forex
EURUSD
GBPUSD
ATR
cTrader Storeで入手可能な取引ボット、インジケーター、プラグインなどの商品は、第三者の開発者が提供するものであり、情報と技術の取得のみを目的としてご利用いただけます。cTrader Storeはブローカーではなく、投資助言や個人的な推奨を行うことも、将来のパフォーマンスを保証することもありません。
この作成者の他の商品


価格
登録日 02/01/2026
2
販売