
Descripción
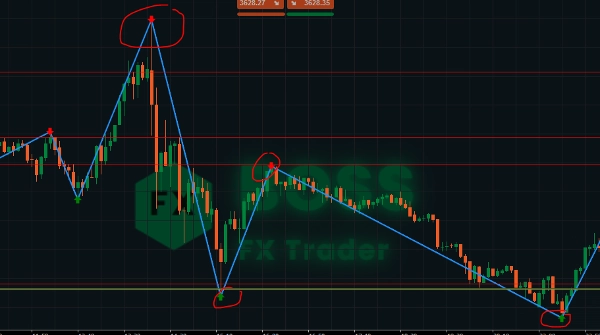
El Indicador ZigZag es una herramienta de estructura de mercado que filtra las pequeñas fluctuaciones de precio y resalta los máximos y mínimos principales. Al conectar estos puntos con líneas, los traders pueden identificar fácilmente tendencias, reversiones y patrones de gráfico.
No genera señales de compra/venta por sí mismo, pero cuando se combina con la acción del precio, soporte/resistencia u otros indicadores, se vuelve poderoso para estrategias de scalping, intradía y swing.
🔎 Características Clave
- Simplifica el ruido del mercado mostrando oscilaciones claras de precio.
- Ayuda a identificar niveles de soporte y resistencia.
- Útil para detectar patrones de gráfico (hombro cabeza hombro, dobles techos/suelos, triángulos).
- Ayuda en la confirmación de tendencia y entradas en retrocesos.
- Indicador de Flechas de Venta y Compra
⚡ Scalping con ZigZag
- Marcos de tiempo: 1m – 5m
- Objetivo: Capturar movimientos pequeños pero frecuentes.
- Cómo usar:
-
- Espera a que se forme un nuevo máximo/mínimo.
- Marca estos como micro-soporte o resistencia.
- Entra en operaciones en rupturas o retrocesos hacia estos niveles ZigZag.
- Mantén el stop-loss justo más allá del último swing (riesgo ajustado).
- Apunta a un TP rápido (5–15 pips dependiendo de la volatilidad).
👉 Funciona mejor en sesiones de alta volatilidad (apertura de Londres / Nueva York).
⏱️ Trading Intradía con ZigZag
- Marcos de tiempo: 15m – 1H
- Objetivo: Operar tendencias diarias y reversiones clave intradía.
- Cómo usar:
-
- Identifica la tendencia intradía principal usando oscilaciones ZigZag más altas.
- Usa los puntos ZigZag como zonas pivote para la entrada (compra en caídas en tendencia alcista, vende en repuntes en tendencia bajista).
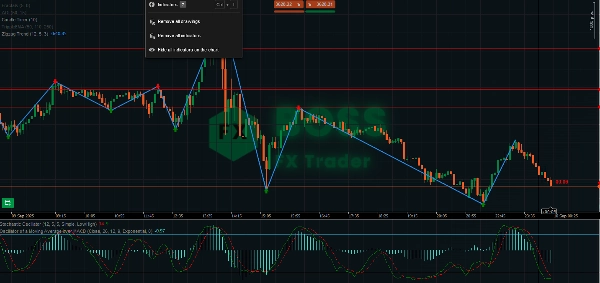
- Combina con osciladores (RSI/Stochastic) para confirmar sobrecompra/sobreventa cerca de los extremos ZigZag.
- Usa el máximo/mínimo anterior como niveles lógicos de SL/TP.
👉 Ideal para traders diarios que buscan movimientos de 20–50 pips.
📆 Swing Trading con ZigZag
- Marcos de tiempo: 4H – Diario
- Objetivo: Capturar grandes movimientos de tendencia y operaciones de posición.
- Cómo usar:
-
- Usa ZigZag para identificar la estructura principal del mercado (máximos más altos y mínimos más altos = tendencia alcista).
- Entra después de retrocesos cuando se forme un nuevo mínimo en una tendencia alcista.
- Coloca SL debajo del último mínimo importante.
- Apunta a 2–3 veces el riesgo, o al siguiente nivel de oscilación ZigZag.
- Usa ZigZag para detectar patrones de reversión (doble techo/suelo, hombro cabeza hombro) para salidas.
👉 Ideal para mantener operaciones por días a semanas.
📌 Consejos Profesionales
- Ajusta la Profundidad: Más pequeña = más sensible (bueno para scalping). Más grande = filtra ruido (mejor para swing).
- Combina con volumen, filtros de tendencia o medias móviles para confirmación.
- Siempre verifica ZigZag en marcos de tiempo superiores antes de entrar — oscilaciones pequeñas dentro de una tendencia mayor pueden ser trampas.
- Usa ZigZag para validar patrones de gráfico (triángulos, cuñas).
¡Manténganse rentables traders!
Resumen
Key features include simplification of market noise, identification of support and resistance levels, trend confirmation, and assistance with pullback entries. It supports multiple trading styles across various timeframes: scalping (1–5 minutes), intraday trading (15 minutes to 1 hour), and swing trading (4 hours to daily). Users can adjust the indicator’s sensitivity to suit different trading approaches and combine it with volume or moving averages for confirmation. The tool is applicable to diverse markets including Forex, indices, commodities, stocks, and cryptocurrencies, supporting symbols like EURUSD, GBPUSD, XAUUSD, NAS100, and BTCUSD.
Valoraciones de clientes
5 | 67 % | |
4 | 33 % | |
3 | 0 % | |
2 | 0 % | |
1 | 0 % |


