
Area of Interest
Indicador
2 compras
Versión 1.0, Aug 2025
Windows, Mac
4.0
Valoraciones: 2
Descripción
1. Propósito del Indicador
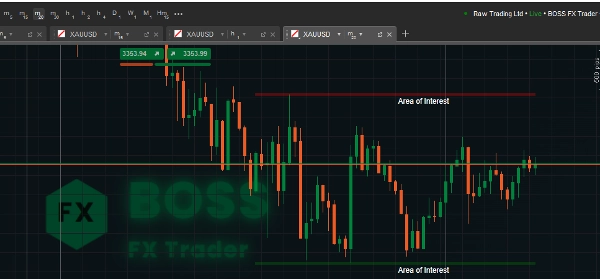
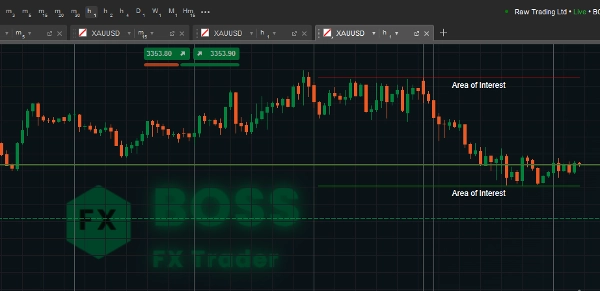
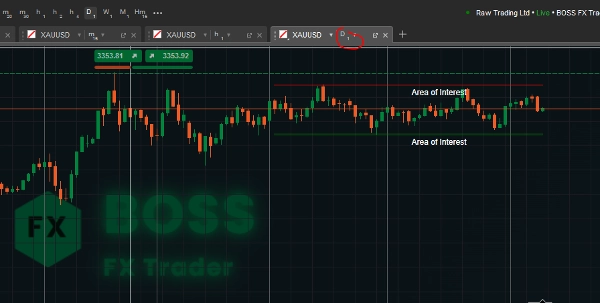
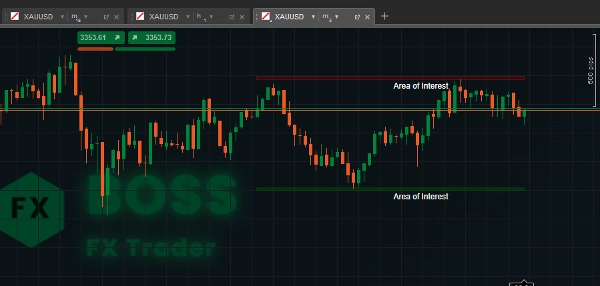
Este indicador Area of Interest de cTrader identifica zonas de soporte y resistencia dentro de un período de retroceso definido por el usuario, y las resalta visualmente como “Áreas de Interés” en su gráfico.
Ayuda a los traders a ver rápidamente niveles clave de precio donde es más probable que ocurran reversiones o rupturas.
2. Cómo Funciona el Código
- Período de Retroceso – La cantidad de barras (velas) anteriores que el indicador escaneará para encontrar el máximo más alto y el mínimo más bajo.
- Valores más altos → zonas más amplias.
- Valores más bajos → niveles más recientes.
- Altura de la Zona – El tamaño vertical (grosor) del área de soporte/resistencia en pips.
- Ayuda a que la zona sea más visible y ajustable.
- Limpia los dibujos antiguos antes de trazar nuevos para evitar desorden.
- Recopila precios altos y bajos para el rango de retroceso.
- Encuentra los niveles de precio más altos y más bajos (resistencia y soporte).
- Convierte la altura de la zona de pips a valor de precio real.
3. Instrucciones de Uso
- Adjuntar el Indicador
-
- Abra cTrader, cargue un gráfico, haga clic en Indicators → Custom → AreaOfInterest.
- Ajustar Parámetros
-
- Período de Retroceso:
-
- Para swing trading → Use valores más grandes (por ejemplo, 100–200).
- Para scalping → Use valores más pequeños (por ejemplo, 20–50).
- Altura de la Zona: Ajuste según su estilo de trading y volatilidad del instrumento.
- Interpretación de las Zonas
-
- Zona Roja (Resistencia) – El precio tiende a revertir o desacelerar al entrar en esta zona.
- Zona Verde (Soporte) – El precio a menudo rebota hacia arriba desde aquí.
- Busque:
-
- Rechazo del precio
- Patrones de velas (pin bars, engulfing)
- Confluencia con otros indicadores (EMA, RSI, Fibonacci)
- Ejemplos de Trading
-
- Operación de Rebote: Entre en largo cerca de la zona verde con un stop justo debajo.
- Operación de Ruptura: Espere a que los precios cierren por encima de la zona roja para una ruptura alcista.
- Detección de Falsa Ruptura: Observe las mechas más allá de la zona pero cerradas dentro (posibles reversiones).
Un trader rentable usó esta herramienta.
Resumen
Resumen de IA
Area of Interest is a cTrader indicator designed to identify and visually highlight key support and resistance zones on trading charts. It scans a user-defined lookback period to detect the highest highs and lowest lows, marking these as “Areas of Interest” to help traders recognize price levels where reversals or breakouts are more likely. Users can adjust the lookback period to focus on broader historical zones or more recent price levels, and set the vertical size (zone height) of these areas in pips for better visibility. The indicator clears previous drawings before plotting new zones to maintain chart clarity. Resistance zones are displayed in red, indicating potential price reversals or slowdowns, while support zones appear in green, suggesting possible price bounces. Traders can use these zones alongside price action signals such as candlestick patterns and other technical indicators to inform trading decisions. Typical applications include entering long positions near support zones, trading breakouts above resistance zones, and detecting false breakouts by observing price wicks relative to the zones. The indicator supports customization to suit different trading styles, including scalping and swing trading, by adjusting the lookback period and zone height parameters.
Perfil del indicador
Valoraciones de clientes
4.0
Valoraciones: 2
5 | 0 % | |
4 | 100 % | |
3 | 0 % | |
2 | 0 % | |
1 | 0 % |
Conversación
Preguntas frecuentes
Los productos disponibles a través de cTrader Store, incluidos bots, indicadores y plugins para operar, son proporcionados por desarrolladores de terceros y están disponibles únicamente con fines informativos y de acceso técnico. cTrader Store no es un bróker, por lo que no proporciona asesoramiento de inversión, recomendaciones personales ni ninguna garantía de rentabilidad futura.


Precio
Desde 29/05/2025
3.04M
Volumen operado
45.22K
Pips ganados
29
Ventas
768
Instalaciones gratis