说明
Impulse Matrix Pro 🚀
它是什么?
https://chartshots.spotware.com/c/69d5282dc32e0
Impulse Matrix Pro 是一个覆盖指标,仅当 三个独立引擎 同时同意时,生成 买入和卖出信号 📈📉。它将趋势检测、冲动突破和智能过滤器结合成一个统一系统,内置风险管理级别 🛡️。
https://chartshots.spotware.com/c/69d5293d873fa
三个引擎 ⚙️
https://chartshots.spotware.com/c/69d5288a347ea
引擎1 — 趋势 (SMEMA) 🌊
双重平滑移动平均线(指数 → 然后简单)创建了 Nexus线。
- 如果它上升 → 趋势是 看涨 🟢。
- 如果下降 → 看跌 🔴。
在它周围,绘制了 3个包络带,上下间隔由平滑平均蜡烛范围决定。价格相对于这些带的位置决定了 强度 (0–3):
强度
含义
1/3
价格超出带1
2/3
价格超出带2
3/3
价格超出带3 ⚡
更高的最小强度 = 更少但 更高质量的信号
引擎2 — 冲动 (BOSWaves)
使用由以下构建的动态带检测 结构突破 事件:
- EMA基线
- 平均绝对偏差 (MAD) 作为波动单位
关键行为: 强烈移动后带收缩(更易触发),盘整时扩展(更难触发)。这由一个 冲动新鲜度 分数控制,随时间衰减 ⏳。
- 看涨突破: 前收盘 ≤ 上带,当前收盘突破上带 🚀。
- 看跌突破: 前收盘 ≥ 下带,当前收盘跌破下带 📉。
引擎3 — 智能过滤器 🛡️
每个信号必须通过三个门槛:
- ATR波动率: 市场有足够波动可交易 🌊
- 动量: 价格在N根柱内实际沿信号方向移动 🏃♂️
- 新鲜度: 冲动未衰减 — 移动仍“活跃” 🔥
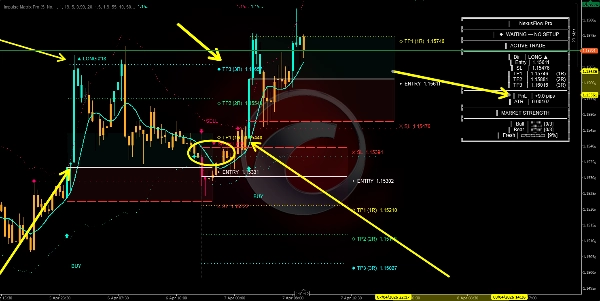
信号条件 🚦
买入 — 所有7项必须为真: ✅
- Nexus线上升
- 牛市强度 ≥ 最低阈值
- 检测到冲动看涨突破
- 方向由看跌转为看涨
- 通过ATR过滤器
- 动量确认向上移动
- 冲动新鲜度高于阈值
卖出 — 所有7项必须为真: ✅
- Nexus线下降
- 熊市强度 ≥ 最低阈值
- 检测到冲动看跌突破
- 方向由看涨转为看跌
- 通过ATR过滤器
- 动量确认向下移动
- 冲动新鲜度高于阈值
注意: 如果任何单一条件不满足 → 无信号 ❌。
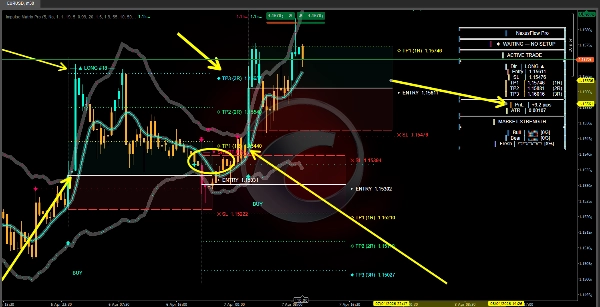
止损和止盈逻辑 📏
所有级别均为 基于ATR且完全自适应 当前波动性 🔄。
- 止损距离 = ATR × 止损倍数(默认1.5)
级别
计算方式
默认风险回报比
止损
入场 ∓ (ATR × 1.5)
— 🛑
止盈1
入场 ± (止损距离 × 1.0)
1:1 🎯
止盈2
入场 ± (止损距离 × 2.0)
1:2 🎯🎯
止盈3
入场 ± (止损距离 × 3.0)
1:3 💰
波动市场 → 更宽的止损和目标。 平静市场 → 更紧的级别。一切自动缩放 ⚖️。
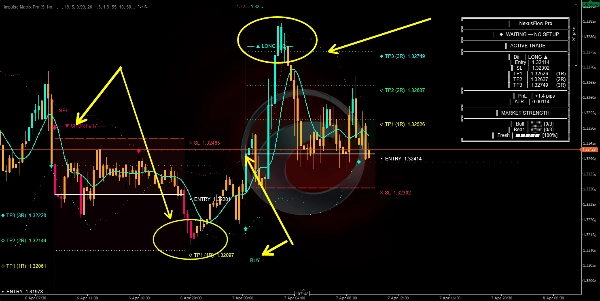
视觉元素 🎨
- Nexus线: 中心趋势方向 🧵
- 包络带: 带有渐变填充的强度测量区域 📊
- 冲动带(虚线): 动态突破阈值 🏁
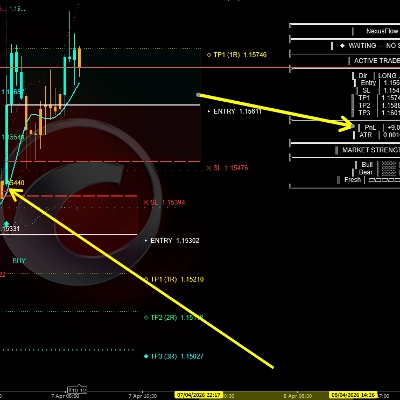
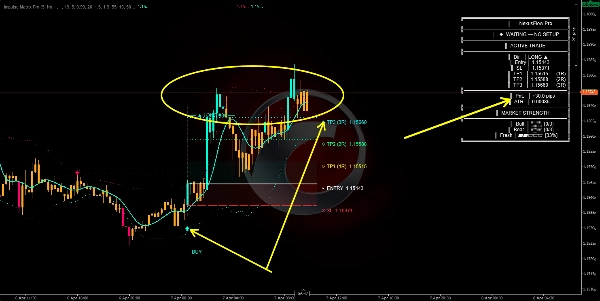
- 买入/卖出箭头: 确认的入场信号 🏹
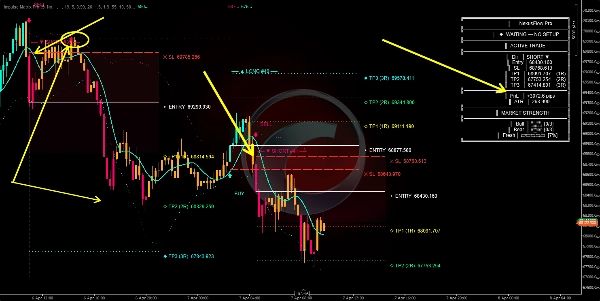
- 白色钻石: Nexus线上的趋势翻转点 💎
- 入场/止损/止盈线: 预期交易级别 📐
- 红色区域: 风险区域(入场到止损) ⚠️
- 绿色/青色区域: 奖励区域(入场到止盈1) 🏆
- 星星 + 横线: 重测信号 — 价格重新访问冲动带但未突破 ⭐
- 趋势云: 显示主导方向的细微背景阴影 ☁️
- 柱颜色: 青色 = 看涨 · 粉色 = 看跌 · 橙色 = 无设置 🎨
- 信息面板(右上角): 实时交易数据,盈亏,强度计,新鲜度计 🖥️
使用方法 📖
- 等待买入/卖出箭头 🏹 — 橙色柱表示无设置,保持观望 🛑。
- 检查面板 🖥️ — 更高的强度和新鲜度 = 更强的信心。
- 交易预期级别 📏 — 止损设定在标记处,在止盈1/止盈2处部分获利,剩余持仓运行至止盈3。
- 重测星星 ⭐ 可作为现有仓位的加仓机会。
- 相反信号 🔄 = 之前的交易概念上无效。
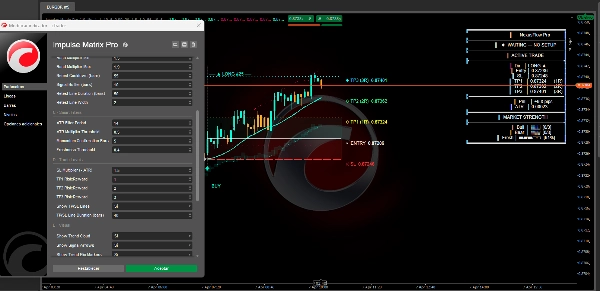
关键参数 ⚙️
参数
较高值
较低值
周期周期
趋势更平滑,信号更慢
更快,更灵敏 ⚡
最小强度
信号更少,过滤更严格
信号更多,过滤更少 🔍
趋势EMA长度
冲动基线更平滑
突破更灵敏 🌊
带倍数
冲动带更宽,突破更少
带更窄,突破更多 📏
ATR阈值
需要更强的波动 🌪️
允许低波动信号
新鲜度阈值
仅新鲜冲动合格 🔥
允许衰减冲动
止损倍数
更宽的止损 🛡️
更紧的止损 🎯
止盈比率
更有野心的目标 💰
更保守的目标
免责声明 ⚠️
此指标 不执行交易。它是一个分析工具 🧠。止盈/止损水平是基于波动性的建议,不是价格保证。最适合 趋势条件 📈。结合市场结构分析和适当的风险管理使用。
摘要
客户评价
5 | 100 % | |
4 | 0 % | |
3 | 0 % | |
2 | 0 % | |
1 | 0 % |