
说明
高级叠加指示器,用于突出关键执行上下文,帮助在一个简化的工作流程中对齐结构、位置和风险。
➤ 主要功能
- 具有可配置灵敏度和确认模式的结构事件标记
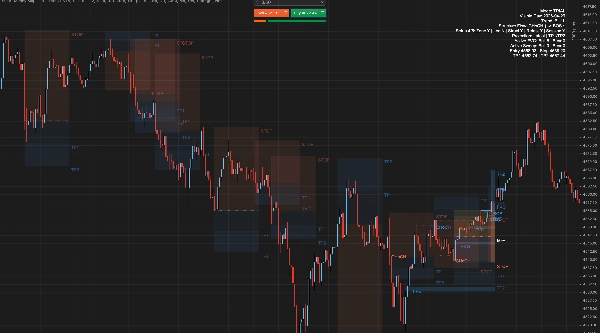
- 具有可配置大小和会话过滤的主动公允价值缺口映射
- 用于早期上下文的流动性扫荡检测(仅评分,最小模式)
- 以50%均衡为基准的溢价/折扣交易范围
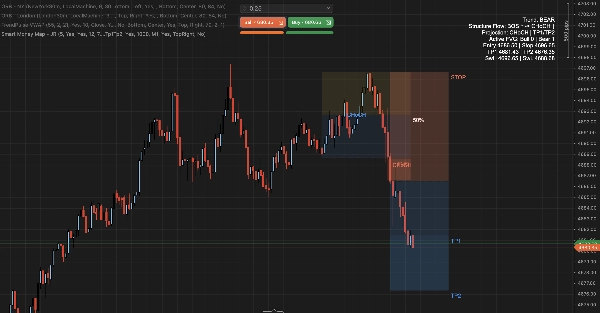
- 动态入场/止损/目标投影框
- 灵活的目标可视化:单一目标、分割TP1/TP2或结构派生目标
- 可选的投影标签可见性和最大止损上限,实现更紧密的日内控制
- 适用于cBot工作流程的自动化输出通道
- 多指标图表的灵活仪表板布局
- 带有可选时间框架自动调整的密度预设
➤ 工作原理
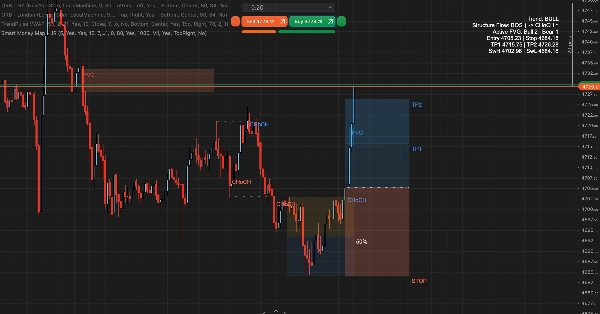
- 确认结构性波动,跟踪方向性转变和延续状态。
- 检测超出保护波动水平的流动性扫荡。
- 映射活跃的不平衡区域,并随着价格与结构的互动进行更新。
- 以溢价/折扣上下文框定当前市场位置。
- 从当前结构状态投影风险地图。
- 发布确定性事件输出以实现自动化。
➤ 适用对象
- 日内SMC图表绘制和执行规划
- 希望获得视觉结构和POI上下文而不产生过多杂乱的交易者
- 需要可配置仪表板布局的多指标设置
➤ 使用方法
- 首先使用仪表板趋势指示器读取结构。
- 利用位置上下文识别溢价和折扣区域。
- 使用活跃不平衡区域和可选的扫荡上下文来优化时机。
- 使用投影地图作为交易规划参考。
➤ 包含控件
- 结构灵敏度和确认模式
- 不平衡大小、会话过滤和缓解显示行为
- 交易范围和投影显示选项
- 投影控件,包括目标模式、锚点模式、标签可见性和可选止损上限
- 密度模式:自定义、M1、M5、M15、H1、H4、D1
- 基于图表时间框架的可选自动密度调整
- 图表可读性的颜色自定义
摘要
AI 摘要
Smart Money Map - JR is an advanced overlay indicator designed for intraday trading to visually highlight key market execution contexts by integrating structure, location, and risk into a streamlined workflow. It identifies and labels structural events with configurable sensitivity and confirmation modes, detects liquidity sweeps beyond swing levels, and maps active fair value gaps with adjustable sizing and session filters. The indicator frames market price zones into premium and discount ranges centered around a 50% equilibrium level.
It features dynamic projection boxes for entry, stop, and target levels, supporting flexible target visualization options including single targets, split take-profits, or structure-derived targets. Users can control projection label visibility and apply maximum stop caps for tighter intraday risk management. The tool supports automation through deterministic event outputs compatible with cBot workflows and allows customizable dashboard placement for multi-indicator chart setups. Density presets with optional automatic timeframe adjustment enhance adaptability across different chart resolutions.
The indicator operates by confirming structural swings, tracking directional shifts, detecting liquidity sweeps, updating imbalance zones as price interacts with structure, and projecting a risk map based on current market conditions. It is suited for traders seeking clear visual structure and points of interest without chart clutter, particularly those focused on Smart Money Concepts (SMC) and market structure analysis.
指标配置
指标分类
市场结构(SMC)
输出类型
可视化
数据要求
仅 K 线
支持的信号
趋势强度
突破水平位
触及水平位
客户评价
4.0
评价:2
5 | 0 % | |
4 | 100 % | |
3 | 0 % | |
2 | 0 % | |
1 | 0 % |
讨论
常见问答
Premium/Discount
MSS
BOS
CHOCH
Market Structure
cTrader Store 提供的所有产品,包括交易机器人、指标和插件,均由第三方开发者提供,仅供信息参考和技术访问之用。cTrader Store 并非经纪商,不提供投资建议、个人推荐或任何未来业绩保证。
该作者的其他作品


价格
注册日期 11/02/2026
14
销售
77
免费安装