
TrendPulse VWAP
インジケーター
4 購入済
バージョン 4.0、Apr 2026
Windows、Mac
5.0
レビュー: 2
説明
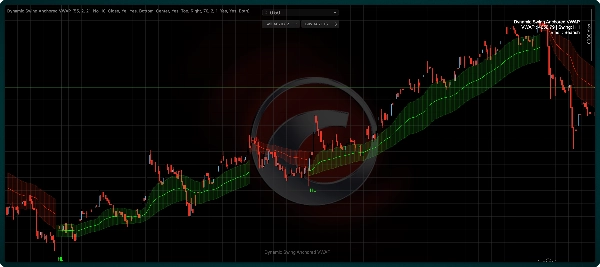
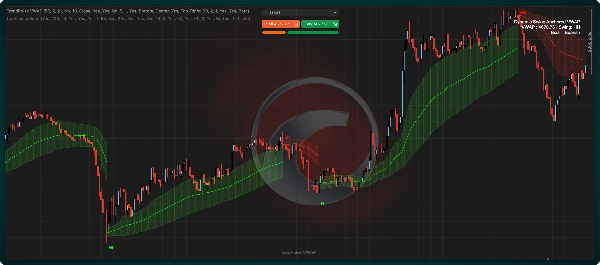
TrendPulse VWAP は、固定されたセッションリセットを使用する代わりに、確認されたスイングピボットに自動的に再アンカーする構造認識型のVWAPインジケーターです。
価格構造、方向性の流れ、および価値ゾーンのより適応的なビューを求めるトレーダー向けに設計されています。このインジケーターは、確認されたスイングの高値と安値を追跡し、アクティブな構造的バイアスを決定し、有意義なピボットからVWAPを再構築することで、ラインが市場の文脈に沿って維持されます。
従来のセッションVWAPとは異なり、このツールは市場構造に従います。強気および弱気の変化を強調表示し、オプションの偏差バンドを表示し、ピボットにラベルを付け、現在のトレンドと最後のスイング状態を示すコンパクトなチャートダッシュボードを表示できます。
➤ 主な特徴
- 設定可能なアンカーポリシーを持つ動的なスイングアンカーVWAP
- 右側のみのスイング検証のための設定可能なピボット確認
- 視覚的構造コンテキストのためのスイング状態ラベリング
- オプションのより厳格なアンカーポリシー制御
- 制御された再アンカーのためのアンカー品質フィルター
- オプションのボラティリティ対応バンドを備えた適応的スムージング
- スパイクキャッピングを伴うティックボリューム処理
- 長期間の履歴のためのレンダリング制御
- 柔軟な配置が可能なコンパクトダッシュボード
- cBotワークフロー向けの自動化対応出力
➤ 動作方法
- 設定されたルックバックおよび確認バーを使用してスイングの高値と安値を確認します。
- 最新の確認済みピボットからアクティブな構造方向を導き出します。
- 視覚的参照のために最新のピボットコンテキストを分類します。
- アンカー受け入れルールが満たされたときにVWAPを再アンカーします。
- 新しいアンカーが受け入れられない場合は、バーごとにアンカーされたVWAP状態を更新します。
- 設定されたボラティリティ測定からオプションのバンドを構築します。
➤ 最適な対象
- 構造認識型VWAPコンテキストを求める日中およびスイングトレーダー
- 制御された再アンカー動作で適応的なトレンドコンテキストを求めるトレーダー
➤ 使用方法
- ダッシュボードのトレンドインジケーターとスイングラベルから構造を読み取ります。
- 確認バーとアンカー品質制御を使用して感度を調整します。
- VWAPとオプションのバンドを使用して、現在の構造に対する位置コンテキストを把握します。
➤ 含まれるコントロール
- スイング感度および確認設定
- 適応スムージングおよびボラティリティバイアス制御
- アンカー品質およびリセットポリシー制御
- バンドモデルおよびバンド距離制御
- ラベル、トレンド背景、およびレンダリングホライズンの視覚制御
- チャートの読みやすさのための色のカスタマイズ
概要
AIによる概要
TrendPulse VWAP is a structure-aware volume-weighted average price (VWAP) indicator that dynamically re-anchors to confirmed swing pivots rather than resetting at fixed sessions. It identifies swing highs and lows using configurable lookback and confirmation settings, determines the current market structure direction, and updates the VWAP line accordingly to reflect meaningful price pivots. This approach provides traders with an adaptive view of price structure, directional flow, and value zones aligned with market context.
Key features include configurable pivot confirmation and anchor quality filters, swing-state labeling for visual structure context, optional volatility-based deviation bands, adaptive smoothing, tick-volume handling with spike capping, and a compact dashboard displaying current trend and last swing state. The indicator supports automation-ready outputs for integration with cBot workflows.
TrendPulse VWAP is suited for intraday and swing traders seeking a dynamic VWAP that adapts to market structure changes with controlled re-anchoring behavior. Users can adjust sensitivity and anchor policies to tailor the indicator’s responsiveness and use the VWAP line and bands to assess price location relative to the evolving trend and confirmed pivots.
インジケーターのプロフィール
インジケーターのカテゴリー
トレンド
出力の種類
ビジュアル表示
シグナル
データ要件
バーのみ
取引高
サポート対象のシグナル
反転
トレンドの強さ
ラインタッチ
カスタマーレビュー
5.0
レビュー: 2
5 | 100 % | |
4 | 0 % | |
3 | 0 % | |
2 | 0 % | |
1 | 0 % |
ディスカッション
よくあるご質問
Forex
Indices
Commodities
XAUUSD
ATR
VWAP
cTrader Storeで入手可能な取引ボット、インジケーター、プラグインなどの商品は、第三者の開発者が提供するものであり、情報と技術の取得のみを目的としてご利用いただけます。cTrader Storeはブローカーではなく、投資助言や個人的な推奨を行うことも、将来のパフォーマンスを保証することもありません。
この作成者の他の商品


価格
登録日 11/02/2026
14
販売
77
無料インストール