

Beschreibung
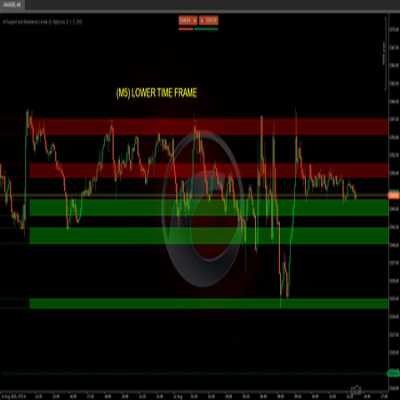
Erkennung von Angebots- und Nachfragezonen anhand von Swing-Pivots, mit Mehrzeitrahmen-Konfluenz und Volumenfilterung. Zonen projizieren 20 Balken nach vorne und verfolgen jeden Retest und Ausbruch – die Zonentransparenz nimmt mit der Zeit ab, MTF-konfluente Zonen erhalten einen soliden Rand, und Rollenwechsel drehen gebrochene Zonen auf die gegenüberliegende Seite.
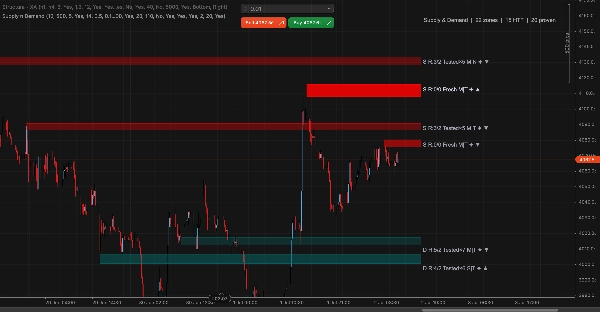
Jede Zone hat ein kompaktes Label mit allen Qualitätsindikatoren: S/D-Typ, Retest-/Ausbruchszählungen, Frische (Frisch/Getestet×N), Explosivität (Stark/Mittel/Schwach), Basisspannweite (Eng/Normal/Breit), HTF-Konfluenz (✦) und Volumen bei der Bildung (▲/▼). Frische + ✦ + ▲ Zonen sind von höchster Qualität – unberührt, bestätigt durch H4-Struktur und auf erhöhtem Volumen gebildet.
➤ FUNKTIONEN
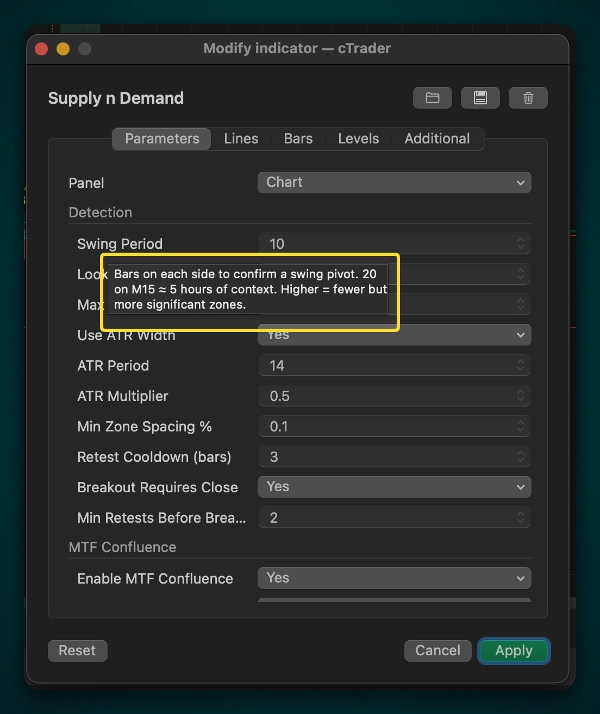
• Swing-Pivot-Erkennung mit konfigurierbarem Zeitraum (Standard 20 auf M15)
• H4 HTF-Hard-Gate – es werden nur Zonen erstellt, die mit der H4-Struktur überlappen (optional)
• Multi-Touch-Schutz – Zonen müssen N Retests überstehen, bevor ein Ausbruch gezählt wird
• Volumenfilter – Zonen, die bei überdurchschnittlichem Tick-Volumen gebildet werden, erhalten das ▲-Tag
• Zonen-Flip / Rollenwechsel – gebrochenes Angebot wird zur Nachfrage (und umgekehrt)
• Visuelles Verblassen – die Deckkraft nimmt mit Berührungen ab; globaler Fade%-Regler steuert die Transparenz
• Trendlinien-Grenzlinien – auf die Zonenausdehnung zugeschnitten, stärker bei HTF-Zonen
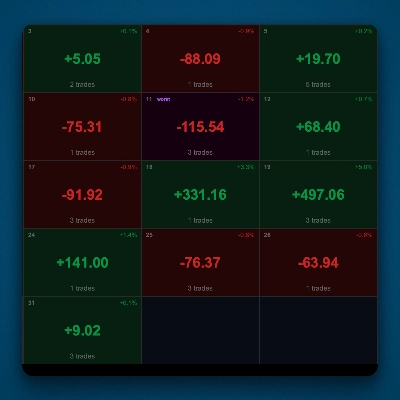
• Kompaktes Dashboard – Zonenanzahl, HTF-Anzahl, bewährte Zonenanzahl oben rechts
• Erhalt bewährter Zonen – Zonen mit 3+ Berührungen verfallen nie
➤ PARAMETERGRUPPEN
Erkennung – Swing-Periode, ATR-Multiplikator/-Größe, Ausbruchsregeln, Retest-Abkühlzeit
MTF-Konfluenz – H4-Referenz, HTF-Hard-Gate-Umschalter, HTF-Swing/Lookback
Volumen-Konfluenz – Volumen-MA, Schwellenwert %, Niedrigvolumen-Unterdrückung
Stil – Farben, Randstärke, Label-Sichtbarkeit
Visuell – globaler Fade%, Dashboard-Umschalter
➤ HANDELSABLAUF
1. Hochwertige Zonen identifizieren: Frisch, ✦, ▲, enge Basis
2. Warten, bis der Preis die Zone erreicht – NICHT nur bei Berührung einsteigen
3. Auf Kerzenbestätigung warten (Engulfing, Pin Bar, Hammer bei Nachfrage; Shooting Star, Engulfing bei Angebot)
4. Stop-Loss außerhalb der Zonengrenze + Puffer; Take Profit an der nächsten gegenüberliegenden Zone
5. Bei Flipps: Auf Retest NACH dem Ausbruch warten, dann Bestätigungskerze
➤ EMPFOHLENE EINSTELLUNGEN
• Scalping (M1-M5): Swing=8, ATR=1.0, HTF=H1, RequireHTF=false
• Intraday (M15-M30): Swing=20, ATR=1.5, HTF=H4, RequireHTF=true (Standard)
• Swing (H1-D1): Swing=20, ATR=2.0, HTF=D1/W1, RequireHTF=true
➤ LABEL LESEN
Jede Zone hat ein Label an ihrer rechten Kante mit komprimierten Qualitätsinformationen. Beispiel: S R:3/2 Tested×5 M|N ✦ ▼
Aufschlüsselung
- S / D - Angebot (Widerstand) oder Nachfrage (Unterstützung)
- R:3/2 - Retests:3 / Ausbrüche:2 — Zone hielt 3 Mal, wurde 2 Mal durchbrochen
- Tested×5 - Gesamtberührungen (Retests + Ausbrüche = 5) — Frischeindikator
- M|N - Explosivität|Basis: M=Moderat, N=Normale Basisspannweite
- ✦ - HTF-Konfluenz bestätigt — Zone überlappt eine H4-Zone desselben Typs
- ▼ / ▲ - Volumen bei Bildung: ▲=überdurchschnittlich (stark), ▼=unterdurchschnittlich (schwächer)
Wie man Zonen auf einen Blick liest
- Frisch + ✦ + ▲ — höchste Qualität: unberührt, bestätigt durch höheren Zeitrahmen, auf erhöhtem Volumen gebildet
- Tested×5-7 — Zone wurde mehrfach getestet, Wahrscheinlichkeit des Haltens nimmt mit jeder Berührung ab
- Je transparenter (verblasster) eine Zone ist — desto geringer das Bildungsvolumen oder desto mehr Berührungen hat sie. Visuelles Alpha zeigt sofort, welche Zonen „abgenutzt“ sind
Dieser Indikator dient nur zur Analyse. Er führt keine Trades aus. Testen Sie immer auf einem Demokonto, bevor Sie live gehen.
Zusammenfassung
Each zone features a compact label displaying key quality signals: zone type (Supply or Demand), retest and breakout counts, freshness, explosiveness, base tightness, higher timeframe confluence, and volume at formation. Zones formed on above-average tick volume and confirmed by H4 structure are marked as highest quality.
Key features include configurable swing pivot detection, optional H4 hard gate filtering, multi-touch protection requiring zones to survive multiple retests before breakout recognition, volume-based filtering, visual fading of zones with age or touches, and preservation of proven zones with three or more touches. A compact dashboard shows zone counts and quality metrics.
Parameters cover detection settings, multi-timeframe and volume confluence, visual style, and dashboard options. Recommended settings vary by trading style, from scalping to swing trading. The indicator provides visual support and resistance levels with detailed quality metrics for analysis but does not execute trades.
Diskussion
Kundenbewertungen
5 | 100 % | |
4 | 0 % | |
3 | 0 % | |
2 | 0 % | |
1 | 0 % |

Häufig gestellte Fragen (FAQ)









Preis