说明
主要顶底指标:全面概述
介绍
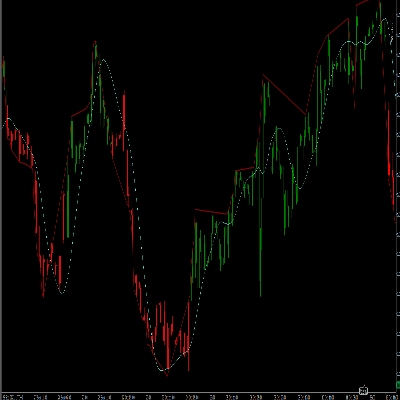
在快节奏的交易世界中,拥有合适的工具可以带来巨大的不同。主要顶底指标旨在识别市场中的关键转折点,使交易者能够做出明智的决策。这个强大的工具利用先进的算法来定位重要的高点和低点,增强您的交易策略并提升整体表现。该指标在45分钟时间框架上的平均准确率约为60%至70%,是希望利用市场波动的交易者的可靠资产,非常适合日内交易者和剥头皮交易者。
主要特点
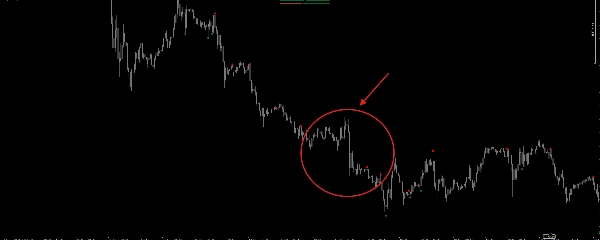
1. 可视化表现
主要顶底指标提供了市场动态的清晰可视化表现。主要顶点用红色标记,主要底点用绿色标记,交易者可以快速识别潜在的反转点。使用点标记确保这些关键水平在图表上突出显示,使交易机会一目了然。
2. 精确计算
主要顶底指标的核心在于其计算方法。通过分析最近四根K线的价格走势,指标判断是否形成了主要顶点或底点。这是通过对高低价进行一系列比较实现的,确保只识别重要的转折点。
3. 增强的剥头皮技术
对于专注于剥头皮交易的交易者来说,主要顶底指标是无价的资产。通过识别关键转折点,交易者可以精准地进出仓位。快速识别主要顶点和底点的能力允许紧密设置止盈(TP)和止损(SL),最大限度地降低风险,同时最大化潜在收益。鉴于其在45分钟时间框架上的准确率约为60%至70%,强烈建议使用止损以减轻信号失误时的潜在损失。
使用主要顶底指标的好处
1. 改善决策能力
主要顶底指标使交易者能够基于准确的市场分析做出明智的决策。通过识别重要的高点和低点,交易者可以更好地预测价格走势并相应调整策略。这种改进的决策过程提升了整体交易表现。
2. 增加盈利潜力
凭借定位关键转折点的能力,交易者可以更有效地利用市场反转。主要顶底指标使交易者能够在最佳时机入场,提升盈利潜力。通过使用紧密的止盈和止损水平,交易者可以最大化收益,同时最小化风险暴露。
3. 用户友好界面
主要顶底指标以用户体验为设计理念。主要顶点和底点的清晰可视化表现确保交易者能够轻松解读指标提供的信号。这个用户友好界面使其适用于所有经验水平的交易者。
4. 多功能应用
无论您是日内交易者、波段交易者还是剥头皮交易者,主要顶底指标都可以应用于各种交易策略。其多功能性使其成为任何交易者工具箱中的宝贵补充,允许更灵活地适应不同的市场状况。
结论
总之,主要顶底指标是一款强大的工具,通过识别关键的市场转折点来增强交易策略。凭借其精确的计算、可视化表现以及与cTrader平台的兼容性,该指标使交易者能够做出明智的决策并利用市场波动。准确率约为70%,因此在信号失误时实施止损以减少损失至关重要。为了获得最佳效果,建议在45分钟时间框架上使用此指标。无论您是经验丰富的交易者还是刚入门,主要顶底指标都能显著提升您的交易表现。立即将这一创新工具纳入您的策略,提升您的交易体验。
摘要
客户评价
5 | 50 % | |
4 | 50 % | |
3 | 0 % | |
2 | 0 % | |
1 | 0 % |