
说明
cTrader 分析工具警报是一款多合一指标,旨在通过为各种绘图工具添加警报、标签和自动颜色编码来增强您的图表体验。
功能:
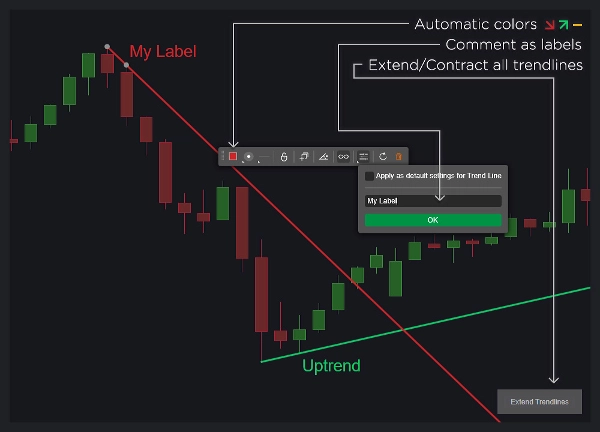
- 趋势线:
-
- 使用对象注释显示自定义标签。
- 根据趋势线方向动态更改颜色。
- 警报后可选择移除趋势线。
- 启用或禁用特定趋势线的警报。
- 一键扩展或收缩所有趋势线。
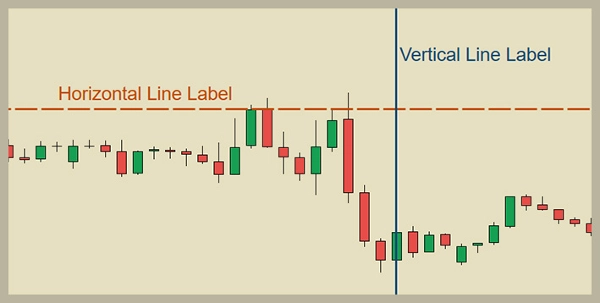
- 水平线和垂直线:
-
- 使用对象注释显示自定义标签。
- 警报后自动删除线条。
- 为每种线条类型配置警报。
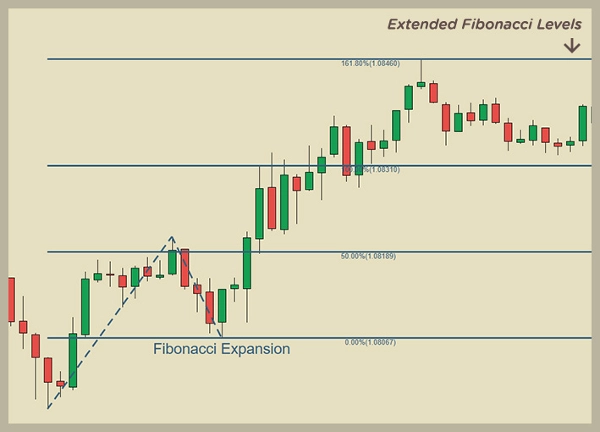
- 斐波那契回撤和扩展水平:
-
- 使用对象注释显示自定义标签。
- 自动将水平线延伸至无限远。
- 警报后可选择删除对象。
- 根据绘图方向分配颜色。
- 启用或禁用斐波那契水平的警报。
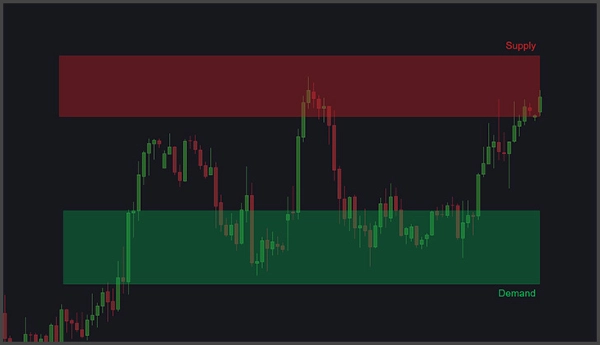
- 矩形(供需区域):
-
- 使用对象注释显示自定义标签。
- 价格交互和成交量激增的警报。
- 设置成交量激增警报参数,包括回溯柱数、成交量百分比增加及警报后暂停期。
- 自动填充矩形并延伸至当前蜡烛。
- 整体自定义:
-
- 调整每种对象类型的标签位置和文字大小。
- 自定义自动颜色。
- 在警报消息中包含对象注释。
- 启用或禁用每种对象类型的警报。
- 警报和帮助:
-
- 通过声音、弹出窗口、Telegram 和电子邮件接收警报。
- 自动将图表截图发送到 Telegram。
- 通过图表上的小按钮访问用户指南。
此工具非常适合在策略中使用支撑与阻力、供需、斐波那契或趋势线的交易者。
摘要
AI 摘要
VegaXLR - Analysis Tools Alerts is an all-in-one indicator for the cTrader platform that enhances chart analysis by integrating alerts, labels, and automatic color-coding with various drawing tools. It supports trendlines, horizontal and vertical lines, Fibonacci retracement and expansion levels, and rectangles representing supply and demand areas.
Key features include:
- Trendlines: Custom labels from object comments, dynamic color changes based on direction, options to remove or extend trendlines after alerts, and toggle alerts per trendline.
- Horizontal and Vertical Lines: Custom labels, automatic deletion after alerts, and configurable alerts per line type.
- Fibonacci Levels: Custom labels, infinite extension of level lines, color assignment by drawing direction, and alert enable/disable options.
- Rectangles (Supply and Demand): Custom labels, alerts for price interactions and tick volume spikes with adjustable parameters, automatic fill and extension to the active candle.
- Overall customization allows adjustment of label positions, text sizes, automatic colors, inclusion of comments in alerts, and enabling/disabling alerts per object type.
- Alerts can be received via sound, pop-ups, Telegram, and email, with automatic chart screenshots sent to Telegram.
- A user guide is accessible directly on the chart.
This tool is suited for traders employing support and resistance, supply and demand, Fibonacci, or trendline strategies.
指标配置
指标分类
支撑与阻力
输出类型
可视化
数据要求
仅 K 线
支持的信号
交叉
突破
触及水平位
突破水平位
反转
趋势强度
客户评价
4.5
评价:2
5 | 50 % | |
4 | 50 % | |
3 | 0 % | |
2 | 0 % | |
1 | 0 % |
讨论
常见问答
Fibonacci
Forex
Supply & Demand
Support & Resistance
cTrader Store 提供的所有产品,包括交易机器人、指标和插件,均由第三方开发者提供,仅供信息参考和技术访问之用。cTrader Store 并非经纪商,不提供投资建议、个人推荐或任何未来业绩保证。
该作者的其他作品


价格
215
销售
677
免费安装