
说明
VegaXLR - RSI 和 StochRSI 警报是一个 cTrader 指标,提供 RSI 和 StochRSI 事件的警报,帮助交易者及时了解市场变化。它会通知用户超买/超卖水平、中线交叉以及 K/D 线交叉,所有这些均可自定义设置。
主要特点:
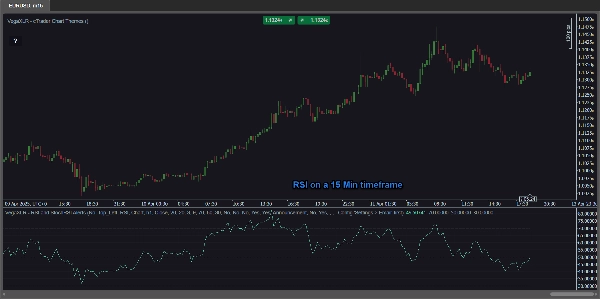
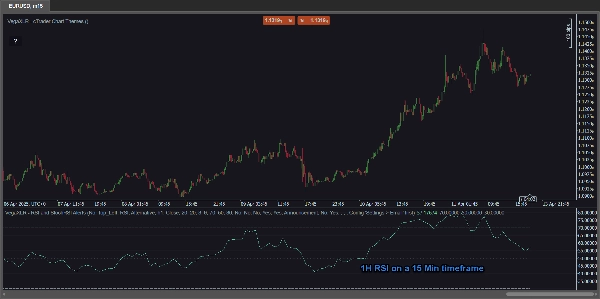
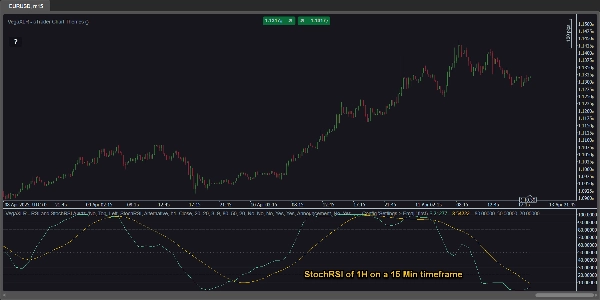
- 多时间框架分析: 独特地在当前图表上直接查看 任意 时间框架的 RSI 和 StochRSI 值。例如,在查看 15 分钟图表时分析 1 小时 RSI——无需更改图表时间框架!
- RSI 和 StochRSI 警报: 接收以下通知:
-
- 超买和超卖状态
- 中线交叉(50%)
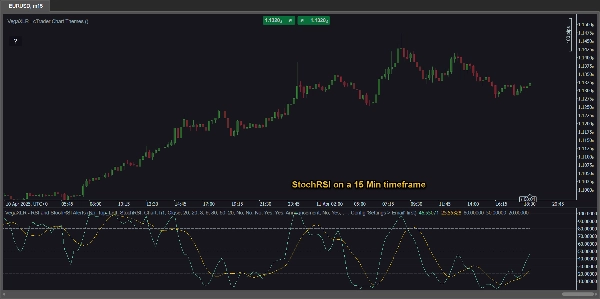
- K 线和 D 线交叉(StochRSI)
- 可自定义设置: 调整 RSI 来源、周期、K/D 值和警报阈值,实现精确控制。
- 多样化警报: 可选择:
-
- cTrader 弹窗
- 声音警报
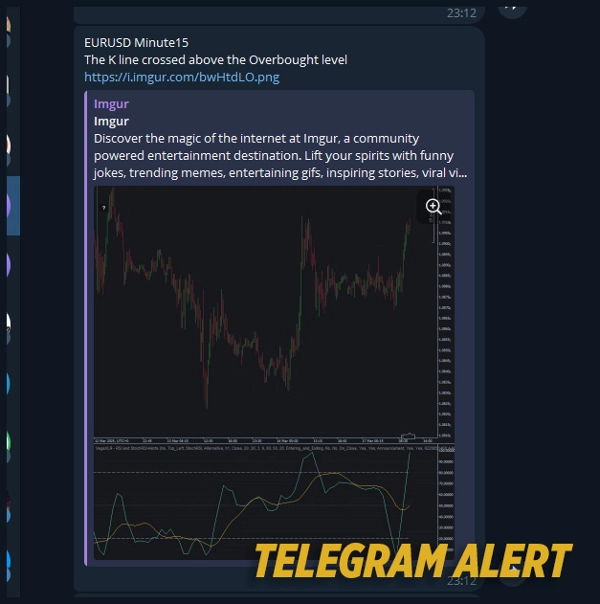
- Telegram 警报(可选图表截图)
- 电子邮件通知
- 集成 RSI 和 StochRSI 线: 无需额外指标——它们已内置!
即时访问指南: 图表内的便捷按钮可打开用户手册。
摘要
AI 摘要
VegaXLR - RSI and StochRSI Alerts is a cTrader indicator designed to monitor and notify traders of key RSI and StochRSI events. It provides alerts for overbought and oversold conditions, centerline (50%) crossovers, and K/D line crossovers within the StochRSI. The indicator supports multi-timeframe analysis, allowing users to view RSI and StochRSI values from any timeframe directly on their current chart without switching timeframes. Customizable settings enable adjustment of RSI source, periods, K/D values, and alert thresholds for tailored monitoring. Alert delivery options include cTrader popups, sound alerts, Telegram notifications (with optional chart screenshots), and email messages. The indicator integrates RSI and StochRSI lines internally, eliminating the need for additional indicators. An in-chart button provides instant access to the user manual for guidance. This tool assists traders in identifying precise market shifts and potential trade entry points based on momentum indicators.
指标配置
客户评价
4.5
评价:4
5 | 75 % | |
4 | 0 % | |
3 | 25 % | |
2 | 0 % | |
1 | 0 % |
客户评价
July 23, 2026
Very good and lots of options, Vega is one of the best. The problem is that the indicator no longer sends alerts, making it a bad choice (purchase). Ctrader is saying the coders are to blame for not udating their algos. I agree in part. However, I'm considering saving my money now as they render half of the indictaors obsolete with 6 monts. Ctrader what are you doing? Dont buy this until a 2026 update because it wont work until Vega fixes what ctrader broke.
April 27, 2025
Steady choice for testing for traders who use momentum confirmation. It gives value around oscillator setups, but strong trends can keep signals stretched. A clean test needs 25 oscillator signals, 2 timeframe confirmation and a clear 1R exit plan. The tool is useful when overbought or oversold is treated as context, not a command.
April 26, 2025
April 26, 2025
Good enough to inspect for oscillator setups. it gives a familiar read on overextension and momentum, especially when used for checking stretched conditions before entries. RSI style levels around 30 and 70 help, but I would add a 2 swing divergence check. The tool is useful when overbought or oversold is treated as context, not a command.
讨论
常见问答
RSI
cTrader Store 提供的所有产品,包括交易机器人、指标和插件,均由第三方开发者提供,仅供信息参考和技术访问之用。cTrader Store 并非经纪商,不提供投资建议、个人推荐或任何未来业绩保证。
该作者的其他作品


价格
232
销售
696
免费安装