
Side Volume Profile
指标
11 购买
版本 1.0, Aug 2025
Windows 版、Mac 版
4.3
评价:3
说明
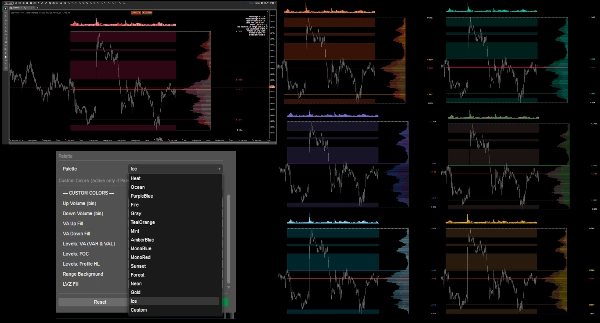
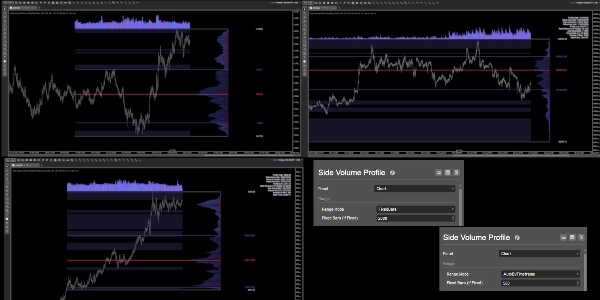
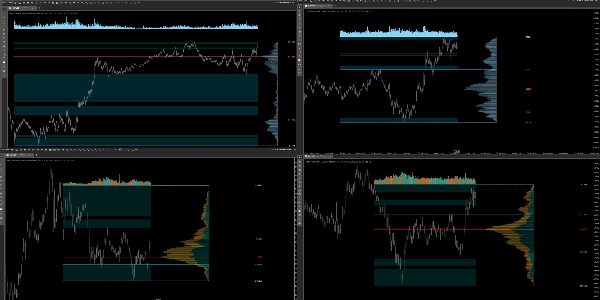
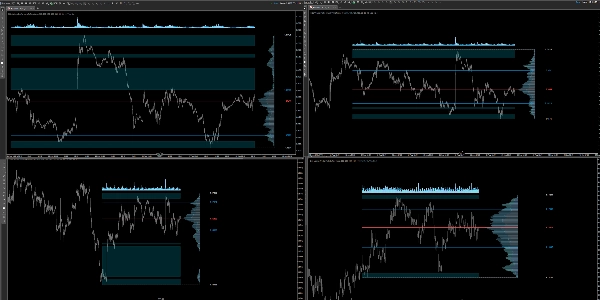
一个右侧的成交量分布图,始终固定在最新的K线,并且在平移图表时不会跳动。它计算选定范围内的按价格划分的成交量(根据时间框架自动或固定的K线数量),显示POC、VAH/VAL、分布边界(高点/低点),突出显示低成交量区域(LVZ),并绘制带有EMA的成交量直方图(以点数偏移)。包括右上角的统计面板、几种高对比度调色板以及自定义颜色、全局柱子透明度、宽度/偏移控制和每条线的粗细/样式。为可读性和性能而设计。
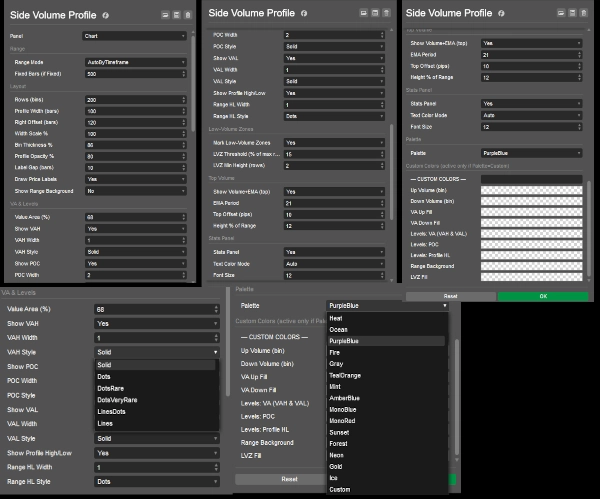
- 范围: 按时间框架自动或固定K线数。
- 布局: 行数(柱子数)、分布宽度/宽度比例、右侧偏移、柱子厚度、标签间距、分布透明度;可选范围背景。
- 价值区和水平: 价值区百分比,切换VAH/POC/VAL,每个水平线宽度和样式;分布高点/低点。
- 低成交量区域: 阈值(最大行的百分比)和最小高度(行数)。
- 顶部成交量: EMA周期,高度(范围的百分比),默认偏移10点。
- 调色板/自定义: 选择主题或设置自定义颜色(VAH = VAL)。
- 统计面板: 切换,字体大小
摘要
指标配置
客户评价
4.3
评价:3
5 | 33 % | |
4 | 67 % | |
3 | 0 % | |
2 | 0 % | |
1 | 0 % |
讨论
常见问答
BTCUSD
Forex
Indices
EURUSD
Commodities
GBPUSD
NZDUSD
Prop
Fair Value Gap
SMC
Crypto
Stocks
XAUUSD
NAS100
USDJPY
VWAP
cTrader Store 提供的所有产品,包括交易机器人、指标和插件,均由第三方开发者提供,仅供信息参考和技术访问之用。cTrader Store 并非经纪商,不提供投资建议、个人推荐或任何未来业绩保证。


价格
注册日期 26/05/2025
381.37M
交易量
60.65K
盈利点数
14
销售
1.39K
免费安装