
الوصف
المشكلة
المتوسطات المتحركة القياسية تتأخر. بحلول الوقت الذي تشير فيه إلى تغير الاتجاه، يكون نصف الحركة قد انتهى بالفعل. تحتاج إلى شيء أسرع—شيء يلتقط الانعكاسات أثناء حدوثها، وليس بعد أشرطة.
الحل
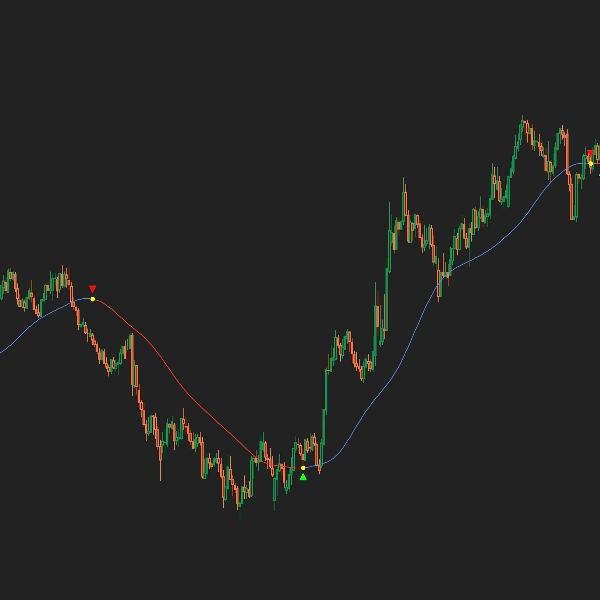
يستخدم Coral فلتر IIR متقدم من 6 مراحل (استجابة نبضية لا نهائية) لتقديم إشارات اتجاه ناعمة للغاية مع تأخير ضئيل. الخط الملون يوضح لك بالضبط متى تتغير الاتجاهات: الأزرق للاتجاهات الصاعدة، الأحمر للاتجاهات الهابطة، ونقاط صفراء عند لحظة الانعكاس الدقيقة.
الميزات الرئيسية
- فلتر IIR من 6 مراحل: خوارزمية تنعيم متقدمة تعتمد على ست مراحل EMA متتالية لإشارات أنظف
- اتجاهات ملونة: خط أزرق للاتجاهات الصاعدة، خط أحمر للاتجاهات الهابطة—وضوح بصري بنظرة واحدة
- نقاط إشارة صفراء: نقاط صفراء تحدد اللحظة الدقيقة لانعكاس الاتجاه
- إشعارات التنبيه: احصل على تنبيهات منبثقة وصوتية عند حدوث انعكاسات الاتجاه
- أسهم الدخول: رموز الأسهم الاختيارية تحدد نقاط الدخول الصاعدة (▲) والهابطة (▼)
كيف يعمل
يطبق Coral فلتر تنعيم أسي من 6 مراحل على بيانات السعر، ثم يحسب الميل لاكتشاف اتجاه الاتجاه. عندما يتغير الميل من سلبي إلى إيجابي، يتم الإشارة إلى انعكاس صاعد. وعندما يتغير من إيجابي إلى سلبي، يتم الإشارة إلى انعكاس هابط. إنشاء الخط المتقطع يخلق تصورًا نظيفًا ومجزأ للاتجاه.
استراتيجية الدخول
- دخول طويل: أحمر → أصفر → أزرق (ادخل عندما يظهر الخط الأزرق بعد إشارة صفراء)
- دخول قصير: أزرق → أصفر → أحمر (ادخل عندما يظهر الخط الأحمر بعد إشارة صفراء)
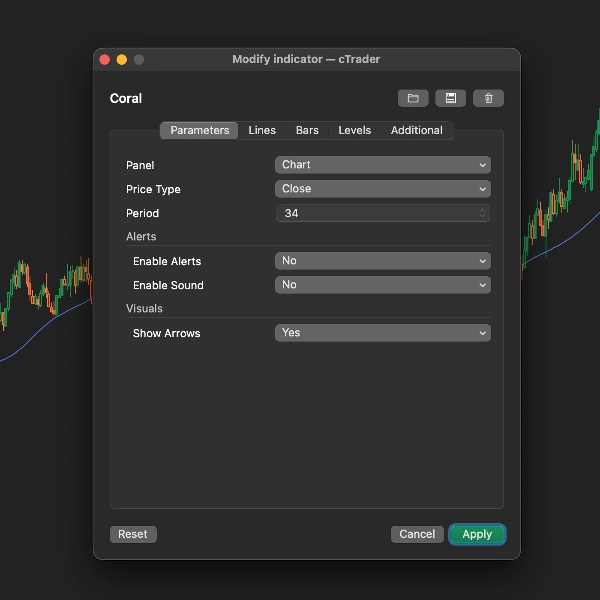
المعلمات
- نوع السعر: مصدر السعر للحساب (الافتراضي: الإغلاق)
- الفترة: فترة التنعيم (الافتراضي: 34) — القيم الأعلى = مزيد من التنعيم
- تفعيل التنبيهات: إشعارات منبثقة عند حدوث الانعكاسات
- تفعيل الصوت: تنبيهات صوتية لتغيرات الإشارة
- عرض الأسهم: عرض رموز الأسهم عند نقاط الانعكاس
المتطلبات
- الإطار الزمني: جميع الأطر الزمنية مدعومة
- الرموز: الفوركس، المؤشرات، المعادن، الأسهم
- نوع الحساب: أي
تحذير المخاطر
التداول ينطوي على مخاطر. الأداء السابق لا يضمن النتائج المستقبلية. هذا المؤشر يوفر إشارات فقط—إدارة المخاطر المناسبة هي مسؤوليتك.
الملخص
تقييمات العملاء
5 | 0 % | |
4 | 100 % | |
3 | 0 % | |
2 | 0 % | |
1 | 0 % |


![شعار "[Hamster-Coder] Moving Average MTF"](https://cdn.ctrader.com/image/webp/b11b98b1-194d-4b8e-b00e-d611826ad159_31226)


