
الوصف
اعرف بالضبط متى تفتح الأسواق الرئيسية وتغلق. يعرض FX Market Sessions الجلسات الأربع الرئيسية للتداول مع مستوياتها العليا والدنيا، مما يساعدك على توقيت دخولك حول أكثر ساعات اليوم تقلبًا.
الميزات الرئيسية
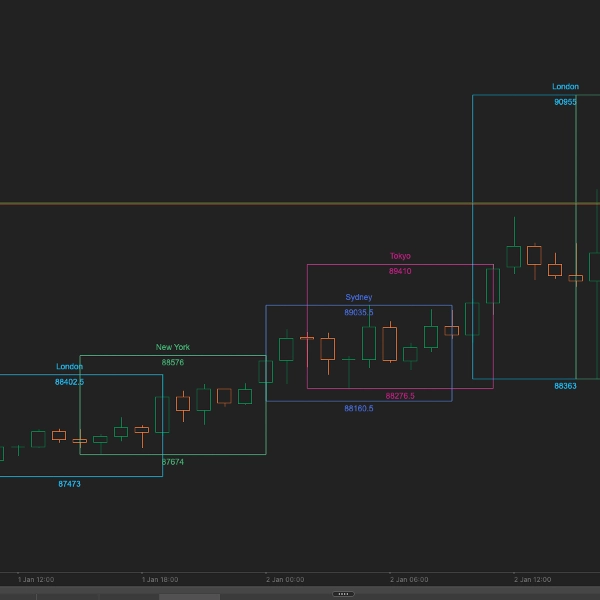
- أربع جلسات رئيسية: جلسات سيدني وطوكيو ولندن ونيويورك معروضة بأوقات بدء/انتهاء قابلة للتخصيص وتعديل تلقائي للتوقيت الصيفي
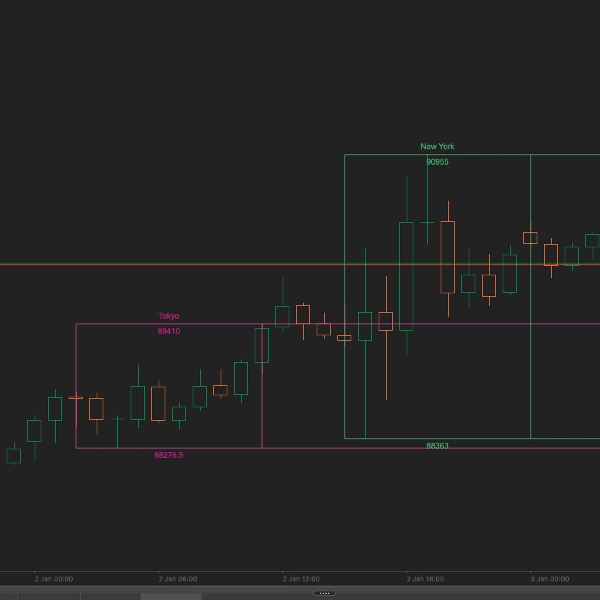
- مستويات الجلسة العليا/الدنيا: يتتبع ويعرض تلقائيًا أعلى وأدنى مستوى لكل جلسة مع خطوط قابلة للتمديد لتخطيط الدعم/المقاومة
- عرض الجلسة الحي: يعرض لوحة المعلومات في الوقت الحقيقي الجلسات المفتوحة حاليًا - لا مزيد من التخمين متى تبدأ جلسة لندن أو نيويورك
- السياق التاريخي: عرض ما يصل إلى 10 أيام من مستويات الجلسات الماضية لرؤية كيفية تفاعل السعر عند حدود الجلسة الرئيسية
- تخصيص كامل: اختر الجلسات التي تريد عرضها، وحدد ألوانًا مخصصة، وقرر ما إذا كنت تريد تمديد مستويات العليا/الدنيا إلى ما لا نهاية
كيف يعمل
يقوم المؤشر بحساب الجلسات الأربع الرئيسية لتداول الفوركس تلقائيًا بناءً على المناطق الزمنية المحلية الخاصة بها:
- سيدني: 21:00-06:00 AEST (يعدل للتوقيت الصيفي)
- طوكيو: 00:00-09:00 JST
- لندن: 08:00-17:00 GMT (يعدل للتوقيت الصيفي)
- نيويورك: 13:00-22:00 EST (يعدل للتوقيت الصيفي)
يتم رسم كل جلسة كمنطقة عمودية مع تحديد مستوياتها العليا والدنيا. تعرض لوحة المعلومات في الزاوية العلوية اليمنى الجلسات المفتوحة حاليًا في الوقت الحقيقي.
المعلمات
الإعدادات العامة
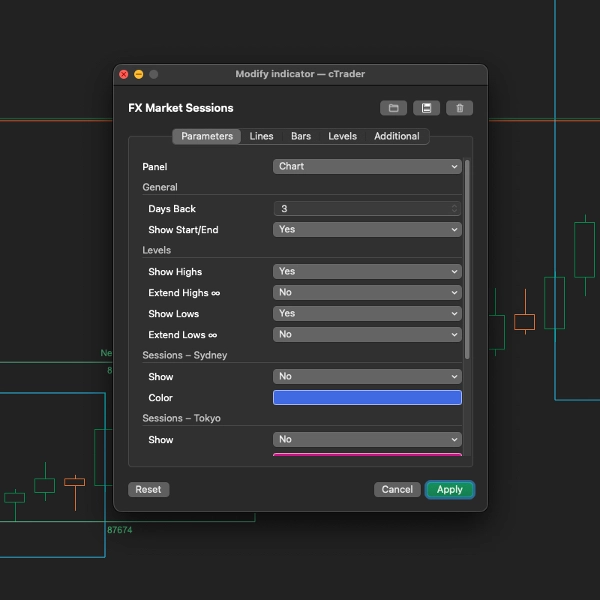
- الأيام السابقة (الافتراضي: 3): عدد الأيام التاريخية لعرض مربعات الجلسة (0-10)
- عرض البداية/النهاية (الافتراضي: صحيح): رسم خطوط عمودية عند أوقات فتح وإغلاق الجلسة
إعدادات المستوى
- عرض الأعلى (الافتراضي: صحيح): عرض المستوى الأعلى لكل جلسة
- تمديد الأعلى (الافتراضي: خطأ): تمديد خطوط الأعلى إلى الحافة اليمنى للمخطط
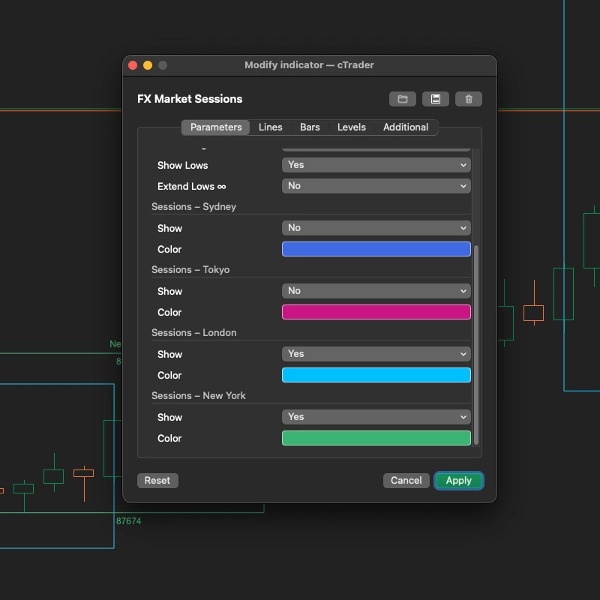
- عرض الأدنى (الافتراضي: صحيح): عرض المستوى الأدنى لكل جلسة
- تمديد الأدنى (الافتراضي: خطأ): تمديد خطوط الأدنى إلى الحافة اليمنى للمخطط
إعدادات الجلسة (سيدني، طوكيو، لندن، نيويورك)
- عرض: تمكين أو تعطيل الجلسات الفردية
- اللون: لون مخصص لعناصر عرض كل جلسة
مثالي لـ
- المتداولين اليوميين الذين يحتاجون إلى معرفة متى تزداد التقلبات
- متداولي الاختراق الذين يتداولون عند فتح الجلسات
- المتداولين الذين يستخدمون مستويات الجلسة العليا/الدنيا كدعم/مقاومة
- أي شخص يرغب في تصور أفضل ساعات التداول
نصائح التداول
- فتح لندن: واحدة من أكثر الفترات تقلبًا - غالبًا ما تحدد اتجاه اليوم
- تداخل لندن/نيويورك: من 13:00 إلى 16:00 بتوقيت غرينتش عادة ما يكون لديه أعلى حجم وتقلب
- الجلسة الآسيوية: الأفضل لتداول أزواج الين الياباني وأزواج الدولار الأسترالي
- اختراقات الجلسة: كسر السعر فوق/تحت مستوى الجلسة العليا/الدنيا يمكن أن يشير إلى تحركات استمرار
الأطر الزمنية المدعومة
يعمل بشكل مثالي على الأطر الزمنية من M5 إلى H4. يقوم المؤشر بضبط مربعات الجلسة تلقائيًا لتناسب مقياس المخطط الخاص بك.
الملخص
Key features include automatic plotting of session high and low price levels, with options to extend these levels across the chart for support and resistance analysis. A live info panel shows which sessions are currently open in real-time. Users can customize which sessions to display, adjust colors, and set how many past days (up to 10) of session data to show, excluding weekends.
The indicator is optimized for intraday timeframes, working best on 5-minute to 4-hour charts. It provides historical context by showing previous session levels, aiding traders in timing entries around periods of increased volatility such as the London open and the London/New York overlap. This tool supports trading strategies that rely on session timing and price levels for breakout and intraday trading decisions.
تقييمات العملاء
5 | 100 % | |
4 | 0 % | |
3 | 0 % | |
2 | 0 % | |
1 | 0 % |


