الوصف
لوحة معلومات الشمعة: معلومات فورية وقابلة للتخصيص عند التمرير فوق أي شمعة
نظرة عامة
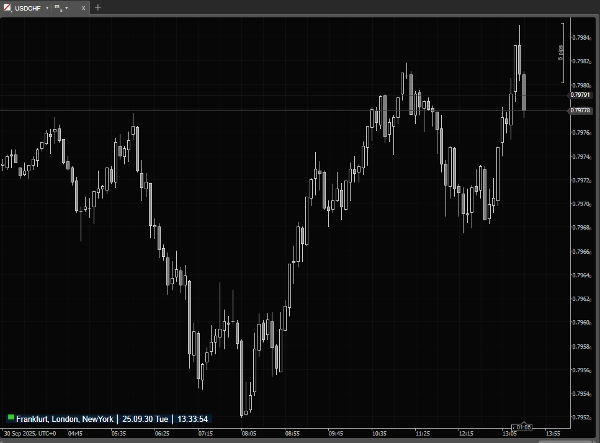
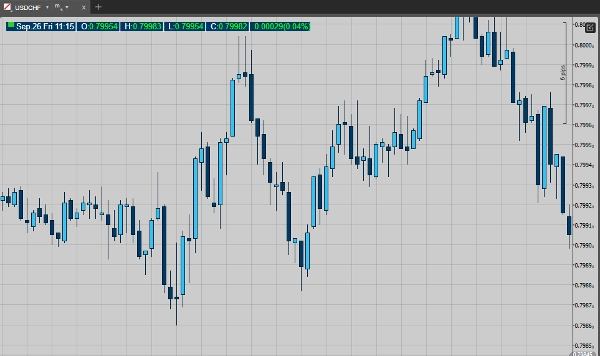
لوحة معلومات الشمعة هي طبقة خفيفة الوزن على cTrader توفر لك معلومات فورية ودقيقة عن أي شمعة على الرسم البياني. عندما يكون مؤشر الماوس خارج الرسم البياني، تعرض سطر حالة مضغوط مع جلسة السوق الحالية ووقت الخادم/المحلي/UTC.
يوفر cTrader بالفعل معلومات الشمعة، ولكن فقط في شريط الحالة الرئيسي للشمعة - مما يعني أنه غير مرئي عند استخدام الرسوم البيانية المنفصلة. كما أنه لا يمكن تخصيصه والخط الصغير غالبًا ما يصعب قراءته بسرعة. تحل لوحة معلومات الشمعة هذه المشكلات من خلال تقديم طبقة واضحة وقابلة للتخصيص بالكامل مباشرة على الرسم البياني.
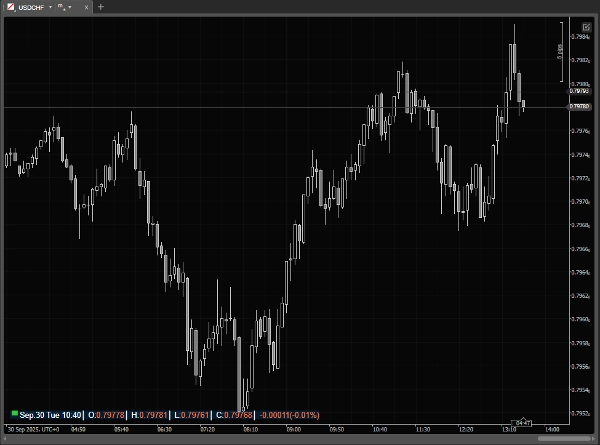
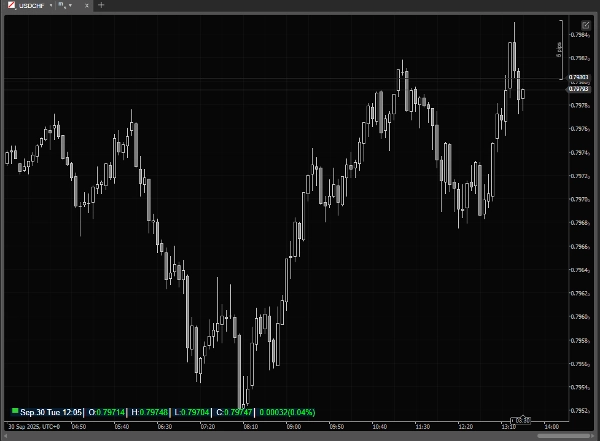
حرك الماوس فوق الشموع وتتوسع اللوحة لتعرض تاريخ الشمعة التي تمرر فوقها، والوقت، والفتح، والارتفاع، والانخفاض، والإغلاق، وحجم التيك، و(اختياريًا) نسبة التغير مقارنة بالشمعة السابقة. جميع العناصر البصرية وتخطيطها قابلة للتخصيص بحيث تناسب سير عملك وموضوع الرسم البياني.
الميزات الرئيسية
· مؤشر جلسة السوق + طابع زمني مباشر (محلي / خادم / UTC).
· لوحة تمرير تعرض: تاريخ الشمعة، الوقت، الافتتاح/الارتفاع/الانخفاض/الإغلاق، حجم التيك.
· عرض اختياري لنسبة التغير (الحالية مقابل الشمعة السابقة).
· وضعان للعرض: مضغوط (عندما يكون الماوس خارج) ومفصل (عندما يكون الماوس فوق الرسم).
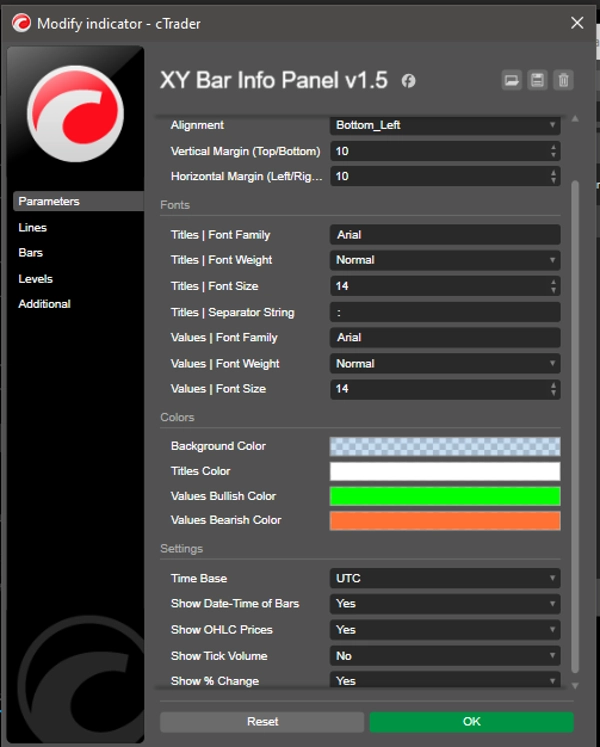
· تسع خيارات وضع + هوامش بكسل للإزاحات الرأسية والأفقية.
· تحكم منفصل في الخطوط للعناوين (التسميات) والقيم (العائلة، الوزن، الحجم).
· سلسلة فاصل العنوان للتسمية المضغوطة.
· ألوان قابلة للتخصيص: خلفية اللوحة، لون العنوان، ألوان القيم الصاعدة (للارتفاع) والهابطة (للانخفاض).
حالات الاستخدام
· قراءة سريعة ودقيقة لقيم الافتتاح/الارتفاع/الانخفاض/الإغلاق والطابع الزمني لأي شمعة تاريخية أو مباشرة بدون استخدام مؤشر التقاطع اليدوي.
· التحقق من حجم التيك ونسبة التغير أثناء مسح حركة السعر.
· مراقبة حالة جلسة السوق ووقت الخادم/المحلي/UTC بنظرة سريعة.
· إعداد لقطات شاشة للرسم البياني أو مواد تعليمية ببيانات شمعة متسقة وقابلة للقراءة.
· ...
لماذا سيحبها المتداولون
على عكس شريط الحالة المدمج في cTrader (الذي يكون ثابتًا في أسفل النافذة الرئيسية، يختفي في الرسوم البيانية المنفصلة، ويستخدم خطوطًا صغيرة غير قابلة للتخصيص)، لوحة معلومات الشمعة مرئية دائمًا حيث تريدها، بخطوط وألوان وتخطيط واضح. توفر الوقت مقارنة بقراءة شريط الحالة أو قيم مؤشر التقاطع يدويًا، تحافظ على نظافة الرسم البياني، وتوفر بالضبط المعلومات التي تحتاجها بنظرة سريعة. خفيفة الوزن وسريعة الاستجابة، صممت للاستخدام اليومي دون إبطاء منصتك.
الملخص
تقييمات العملاء
5 | 100 % | |
4 | 0 % | |
3 | 0 % | |
2 | 0 % | |
1 | 0 % |