
MACD Histogram PRO
مؤشر
4 عمليات الشراء
الإصدار 1.0، Oct 2025
Windows, Mac
4.5
التقييمات: 2
الوصف
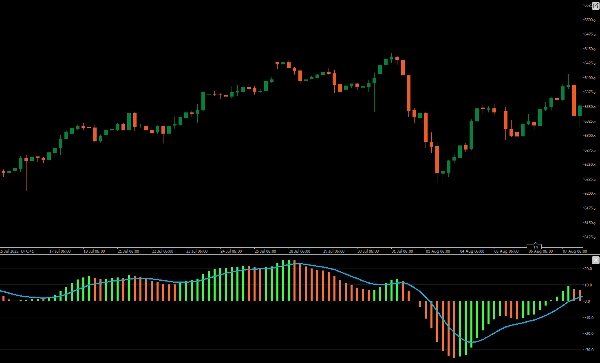
تقديم مخطط MACD المحسن، المصمم لتوفير تجربة تداول أوضح وأكثر فهماً.
يعرض هذا المؤشر المطور مخططًا ملونًا نابضًا يميز بين تغيرات الأسعار الصاعدة والهابطة، متجاوزًا التنسيق أحادي اللون الافتراضي. باستخدام ألوان مميزة للحركات الإيجابية والسلبية، فإنه يقدم إشارة بصرية فورية لحالة السوق، مما يسهل تفسير تحولات الزخم والانعكاسات المحتملة للاتجاه.
مثالي للمتداولين الذين يسعون إلى وضوح ودقة محسنة، يحول هذا مخطط MACD المطور الرسم البياني الخاص بك إلى أداة تحليلية أكثر قوة. ارتقِ باستراتيجيتك التداولية مع مخطط MACD المحسن.
الملخص
ملخص الذكاء الاصطناعي
MACD Histogram PRO is an enhanced technical indicator designed to improve the visualization of the traditional MACD histogram. It displays a vibrant, color-coded histogram that clearly differentiates bullish and bearish price movements, providing immediate visual cues on market momentum and potential trend reversals. This indicator supports analysis across various markets and symbols including Forex (EURUSD, GBPUSD, NZDUSD, USDJPY), cryptocurrencies (BTCUSD, crypto), commodities (XAUUSD, gold, oil, silver), indices (NAS100, SP500, DAX, Dow), and stocks. By using distinct colors for positive and negative momentum shifts, it aids traders in interpreting market conditions with greater clarity and precision. The MACD Histogram PRO is suitable for strategies involving signals and scalping, enhancing chart analysis for more informed trading decisions.
ملف تعريف المؤشر
تقييمات العملاء
4.5
التقييمات: 2
5 | 50 % | |
4 | 50 % | |
3 | 0 % | |
2 | 0 % | |
1 | 0 % |
تقييمات العملاء
October 22, 2025
the only reason it stays interesting is one quick look should not become the only input, and 1.5R target is the line to watch.
October 17, 2025
مناقشة
الأسئلة الشائعة
BTCUSD
Forex
Signal
Indices
EURUSD
Commodities
GBPUSD
NZDUSD
Prop
Scalping
Crypto
Stocks
XAUUSD
NAS100
MACD
USDJPY
يتم توفير المنتجات المتاحة من خلال cTrader Store، بما في ذلك روبوتات التداول والمؤشرات والإضافات، من قبل مطوري الطرف الثالث وإتاحتها لأغراض الوصول المعلوماتي والفني فقط. cTrader Store ليس وسيطًا ولا يقدم نصائح استثمارية أو توصيات شخصية أو أي ضمان للأداء المستقبلي.


السعر
منذ 25/09/2025
25
المبيعات
316
التثبيتات المجانية