
Higher TimeFrame Candle Tracker
Indikator
1 pembelian
Versi 1.0, Oct 2025
Windows, Mac
Deskripsi
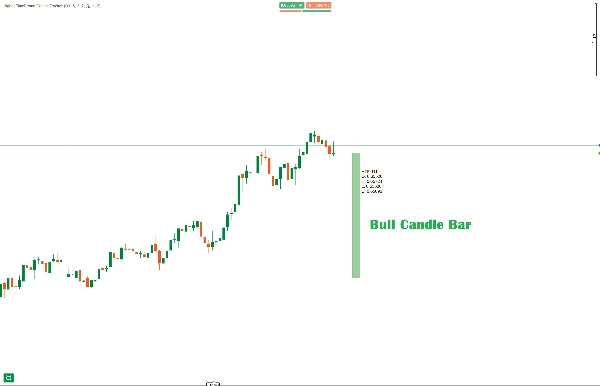
Pelacak candle kerangka waktu lebih tinggi digunakan untuk mendapatkan gambaran tentang seperti apa candle kerangka waktu lebih tinggi yang dipilih.
Fitur Utama:
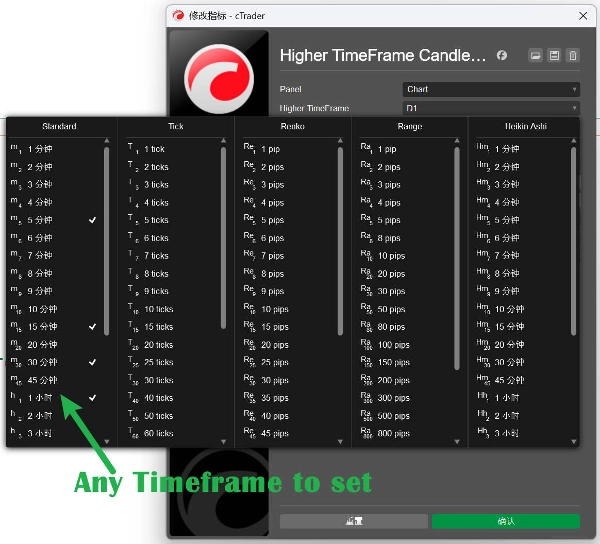
- Pemilihan Kerangka Waktu yang Dapat Disesuaikan - Pilih kerangka waktu lebih tinggi apa saja (Harian, Mingguan, Bulanan, dll.)
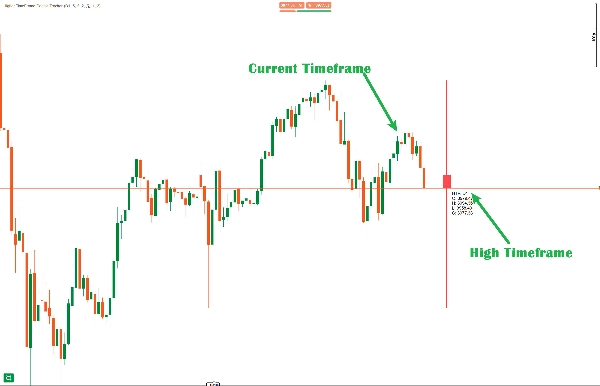
- Tampilan Candle Visual - Candle HTF saat ini diplot dengan sumbu dan badan yang tepat, ter-offset dari aksi harga saat ini
Pengaturan yang Dapat Disesuaikan:
- Offset: Jarak dalam bar dari harga saat ini (default: 5)
- Lebar Candle: Ketebalan badan candle (1-10, default: 3)
- Lebar Wick: Ketebalan garis wick (1-5, default: 1)
- Warna: Warna bull (hijau) dan bear (merah) yang dapat disesuaikan
Kerangka Waktu yang Didukung:
- Menit, Menit2, Menit3, Menit4, Menit5
- Menit10, Menit15, Menit30, Menit45
- Jam, Jam4, Jam12
- Harian, Hari2, Hari3
- Mingguan, Bulanan
Tabel Informasi - Menampilkan data candle HTF waktu nyata: nilai Open, High, Low, Close.
中文说明:
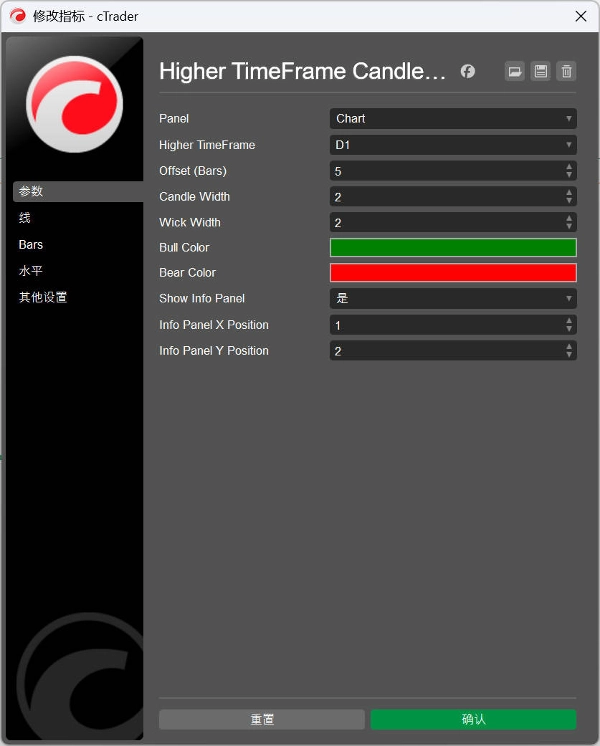
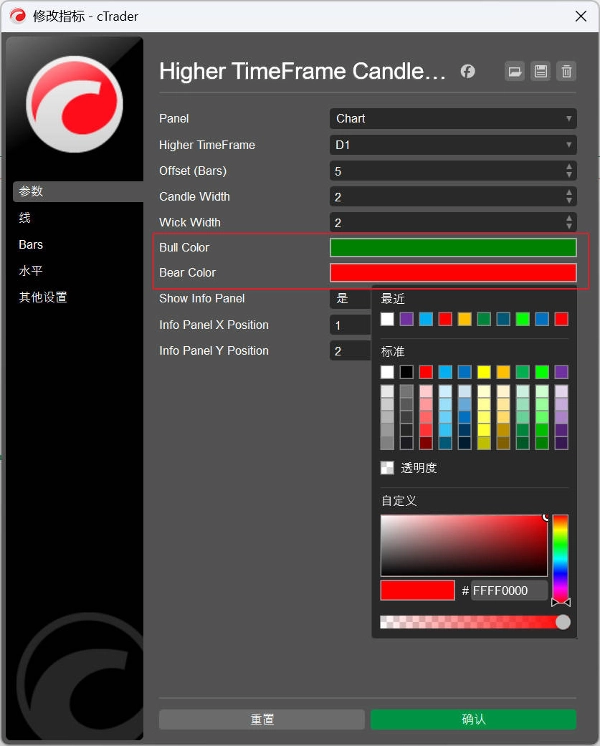
可自定义参数:
- Higher TimeFrame(高时间框架) - 选择要跟踪的时间框架(默认:Daily)
- Offset(偏移量) - K线距离当前价格的位置(默认:5根K线)
- Candle Width(K线宽度) - K线实体的宽度(1-10,默认:3)
- Wick Width(影线宽度) - 影线的宽度(1-5,默认:2)
- Bull Color(看涨颜色) - 看涨K线颜色(默认:Green)
- Bear Color(看跌颜色) - 看跌K线颜色(默认:Red)
- Show Info Panel(显示信息面板) - 是否显示HTF数据面板(默认:true)
核心特性:
- 实时HTF K线显示 - 在图表上绘制当前高时间框架K线
- 完整的K线结构 - 包含实体、上影线和下影线
- 颜色区分 - 自动根据涨跌使用不同颜色
- 信息面板 - 显示Open、High、Low、Close和方向指示
- 自适应填充 - 看涨K线半透明,看跌K线较深
支持的时间框架:
- Menit, Menit2, Menit3, Menit4, Menit5
- Menit10, Menit15, Menit30, Menit45
- Jam, Jam4, Jam12
- Harian, Hari2, Hari3
- Mingguan, Bulanan
Ringkasan
Profil indikator
Ulasan pelanggan
0.0
Ulasan: 0
Ulasan pelanggan
Belum ada ulasan untuk produk ini. Sudah mencobanya? Jadilah pemberi ulasan pertama!
Diskusi
Pertanyaan umum
Prop
Forex
Breakout
Indices
Commodities
Crypto
Stocks
Produk-produk yang tersedia melalui cTrader Store, termasuk bot trading, indikator, dan plugin, disediakan oleh pengembang pihak ketiga serta hanya ditujukan untuk akses teknis dan informasi. cTrader Store bukan broker dan tidak menyediakan saran investasi, rekomendasi pribadi, atau jaminan apa pun tentang kinerja di masa mendatang.


Harga
Sejak 30/09/2024
44
Penjualan