
ATR Bands
Indikator
5 pembelian
Versi 1.0, Oct 2025
Windows, Mac
4.6
Ulasan: 3
Deskripsi
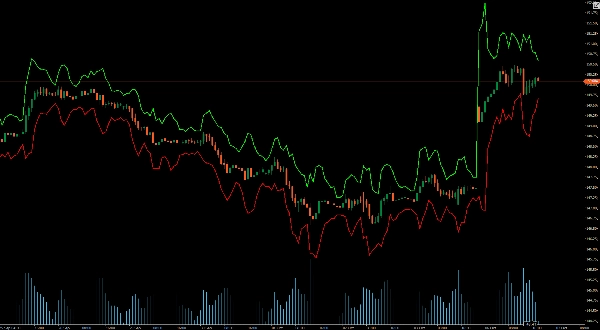
ATR Bands secara dinamis menampilkan pita atas dan bawah pada grafik harga Anda.
Pita ini menawarkan wawasan waktu nyata tentang volatilitas pasar, membantu Anda mengidentifikasi titik breakout dan pembalikan potensial dengan presisi. Sempurna untuk trader dari semua tingkat, ATR Bands meningkatkan proses pengambilan keputusan Anda dengan memberikan petunjuk visual yang jelas untuk menetapkan stop-loss, take-profit, dan mengoptimalkan titik masuk.
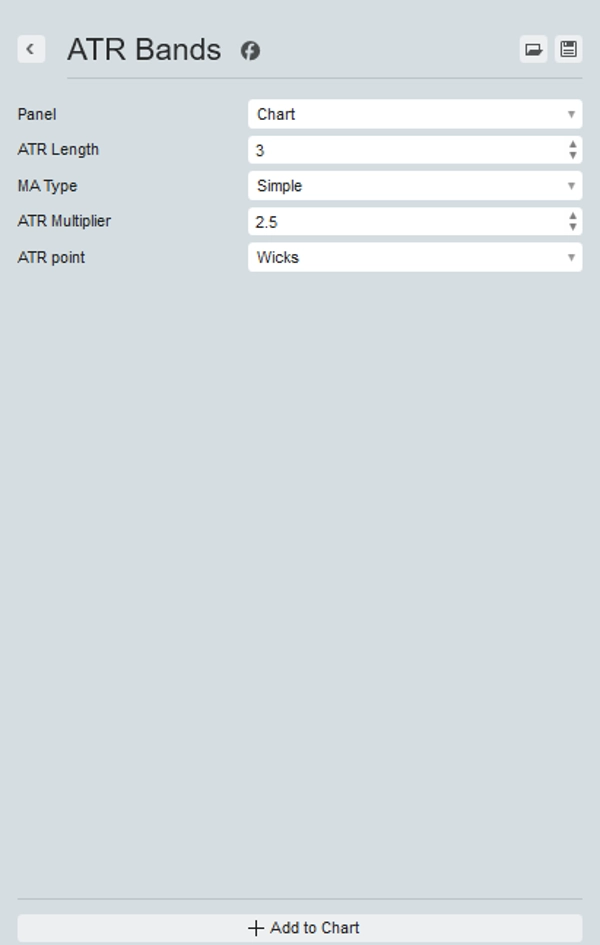
Pengaturan memungkinkan memilih periode dan pengali yang Anda inginkan, mengubah rata-rata bergerak yang digunakan untuk menghitung ATR, dan menggunakan sumbu lilin atau penutupan lilin.
Tingkatkan alat perdagangan Anda hari ini dan rasakan perbedaannya dengan ATR Bands – keunggulan Anda di pasar.
Ringkasan
Ringkasan AI
ATR Bands is a trading indicator that dynamically plots upper and lower bands on price charts based on the Average True Range (ATR). These bands provide real-time visualization of market volatility, assisting traders in identifying potential breakout and reversal points. The indicator supports customizable settings, including the choice of period and multiplier, selection of the moving average type used to calculate ATR, and the option to base calculations on candle wicks or candle closes. ATR Bands are applicable across various markets such as Forex, cryptocurrencies (e.g., BTCUSD), commodities, indices, and stocks. By offering clear visual cues, this tool aids in optimizing entry points, as well as setting stop-loss and take-profit levels.
Profil indikator
Ulasan pelanggan
4.6
Ulasan: 3
5 | 67 % | |
4 | 33 % | |
3 | 0 % | |
2 | 0 % | |
1 | 0 % |
Ulasan pelanggan
October 19, 2025
weak entries have a harder time slipping through, but risk control still needs say no.
October 14, 2025
The better read comes from there is a useful pause before the click, and a few signals across sessions tell more.
October 13, 2025
Diskusi
Pertanyaan umum
BTCUSD
Forex
Breakout
Indices
EURUSD
Commodities
GBPUSD
NZDUSD
Prop
Crypto
Stocks
XAUUSD
NAS100
ATR
USDJPY
Produk-produk yang tersedia melalui cTrader Store, termasuk bot trading, indikator, dan plugin, disediakan oleh pengembang pihak ketiga serta hanya ditujukan untuk akses teknis dan informasi. cTrader Store bukan broker dan tidak menyediakan saran investasi, rekomendasi pribadi, atau jaminan apa pun tentang kinerja di masa mendatang.


Harga
Sejak 25/09/2025
25
Penjualan
315
Instal gratis