
Deskripsi
Memperkenalkan Indeks Kekuatan Sejati (TSI) indikator, alat yang kuat yang dirancang untuk meningkatkan strategi perdagangan Anda dengan memberikan wawasan yang jelas tentang momentum pasar dan kekuatan tren.
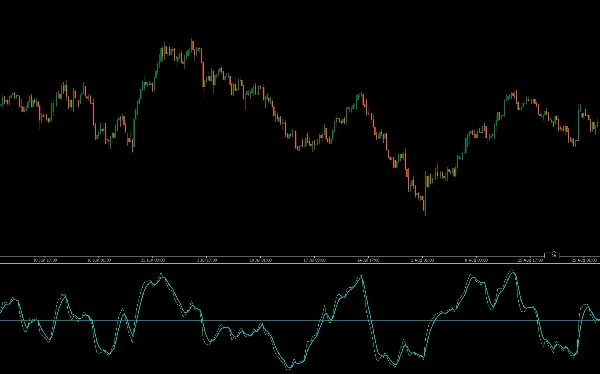
Indikator TSI mengukur kekuatan dasar dari pergerakan harga, meratakan kebisingan pasar untuk memberi Anda gambaran yang lebih akurat tentang arah tren. Dengan menyoroti kondisi jenuh beli dan jenuh jual, TSI membantu Anda mengidentifikasi titik pembalikan potensial dan mengonfirmasi kelanjutan tren.
TSI menggunakan rata-rata bergerak dari momentum dasar sebuah instrumen keuangan. Momentum dianggap sebagai indikator utama pergerakan harga, dan rata-rata bergerak secara karakteristik tertinggal di belakang harga. TSI menggabungkan karakteristik ini untuk menciptakan indikasi harga dan arah yang lebih sinkron dengan pembalikan pasar dibandingkan momentum atau rata-rata bergerak saja.
Sempurna untuk para trader yang ingin menyempurnakan analisis mereka dan meningkatkan pengambilan keputusan, indikator TSI menawarkan cara yang andal dan intuitif untuk mengukur dinamika pasar. Tingkatkan alat perdagangan Anda dengan Indeks Kekuatan Sejati untuk kinerja perdagangan yang superior.
- Identifikasi tren: TSI positif menunjukkan tren bullish, sementara TSI negatif menunjukkan tren bearish.
- Kekuatan momentum: Ini mengukur seberapa kuat sebuah tren bergerak, dengan nilai yang lebih tinggi menunjukkan momentum yang lebih kuat.
- Sinyal pembalikan potensial:
-
- Persilangan: Persilangan garis sinyal di dekat garis nol dapat menandakan titik masuk dan keluar potensial.
- Divergensi: Ketika harga membuat titik tertinggi atau terendah baru, tetapi TSI gagal melakukannya, ini dapat menandakan pembalikan tren potensial.
- Kondisi jenuh beli/jenuh jual: Ini dapat membantu mengidentifikasi kapan sebuah aset mungkin jenuh beli atau jenuh jual, meskipun level jenuh beli dan jenuh jual spesifik dapat bervariasi tergantung pada volatilitas aset tersebut.
Ringkasan
Ulasan pelanggan
5 | 0 % | |
4 | 100 % | |
3 | 0 % | |
2 | 0 % | |
1 | 0 % |


