
DMI 3 bar v2
Indicatore
2 acquisti
Versione 1.0, Dec 2024
Windows, Mac
5.0
Recensioni: 1
Descrizione
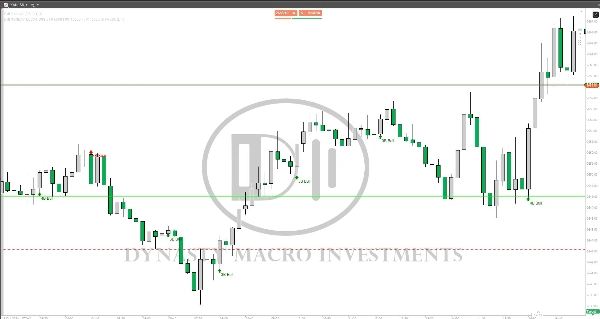
Mostra segnali di ACQUISTO e VENDITA per il PATTERN a 3 e 4 BARRE (Stella del mattino/ Stella della sera). È regolabile e mostrerà FRECCE.
Riepilogo
Riepilogo AI
DMI 3 bar v2 is a technical indicator designed to identify BUY and SELL signals based on 3 and 4 bar candlestick patterns, specifically the Morning Star and Evening Star formations. The indicator is adjustable to user preferences and visually displays signals using arrows on the chart. It supports pattern recognition to assist traders in decision-making by highlighting potential reversal points indicated by these classic candlestick patterns.
Profilo indicatore
Recensioni dei clienti
5.0
Recensioni: 1
5 | 100 % | |
4 | 0 % | |
3 | 0 % | |
2 | 0 % | |
1 | 0 % |
Discussioni
Domande frequenti
I prodotti disponibili tramite cTrader Store, inclusi bot di trading, indicatori e plugin, sono forniti da sviluppatori terzi e resi disponibili esclusivamente a scopo informativo e di accesso tecnico. cTrader Store non è un broker e non fornisce consulenze in materia di investimento, raccomandazioni individualizzate o garanzie di risultati futuri.
Altro da questo autore


Prezzo
2
Vendite