
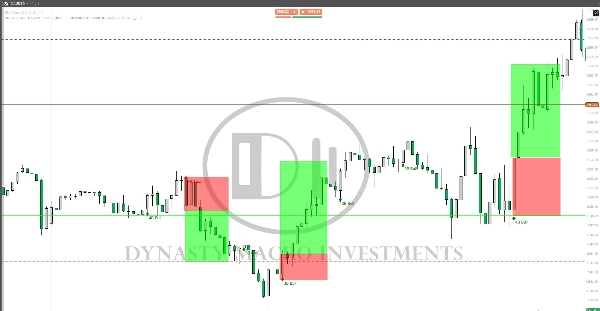
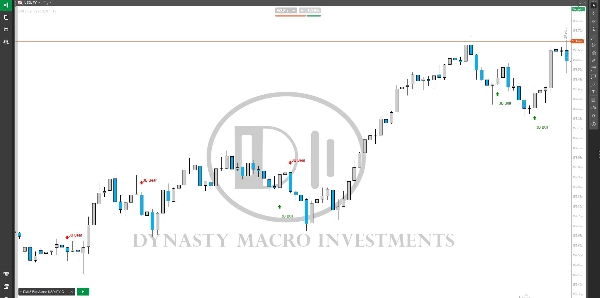
Morning Star On Chart
Indicatore
Versione 1.0, Dec 2024
Windows, Mac
4.0
Recensioni: 1
Descrizione
Pattern Morning Star sul grafico (rialzista e ribassista) contrassegnato automaticamente con (ACQUISTA & VENDI) Segnali molto potenti.
Riepilogo
Profilo indicatore
Recensioni dei clienti
4.0
Recensioni: 1
5 | 0 % | |
4 | 100 % | |
3 | 0 % | |
2 | 0 % | |
1 | 0 % |
Discussioni
Domande frequenti
I prodotti disponibili tramite cTrader Store, inclusi bot di trading, indicatori e plugin, sono forniti da sviluppatori terzi e resi disponibili esclusivamente a scopo informativo e di accesso tecnico. cTrader Store non è un broker e non fornisce consulenze in materia di investimento, raccomandazioni individualizzate o garanzie di risultati futuri.
Altro da questo autore


![Logo di "[CB] Pivot Points Pro"](https://cdn.ctrader.com/image/webp/43463c82-67b0-4f10-a4ba-901bba091d81_32594)


Prezzo
2
Vendite