
Deskripsi
Ikhtisar
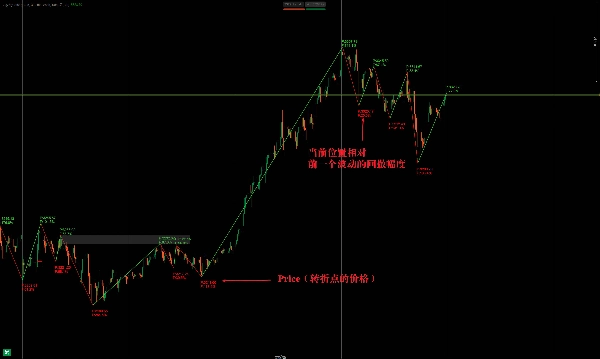
Indikator ZigZag adalah alat analisis teknikal yang terutama digunakan untuk mengidentifikasi titik pembalikan harga utama dengan menyaring kebisingan pasar. Ini menghubungkan titik tertinggi dan terendah yang signifikan dengan garis ZigZag, membantu trader memvisualisasikan tren dan potensi breakout.
Cara Kerja ZigZag
- Fungsi Inti
-
- Ini menghilangkan fluktuasi harga kecil dengan menetapkan ambang perubahan harga minimum (persentase atau nilai tetap).
- Hanya menghubungkan titik ayunan tinggi/rendah yang bermakna, menyederhanakan analisis tren.
- Sering digunakan untuk mendeteksi level support/resistance, pembalikan (misalnya, head & shoulders, double tops/bottoms).
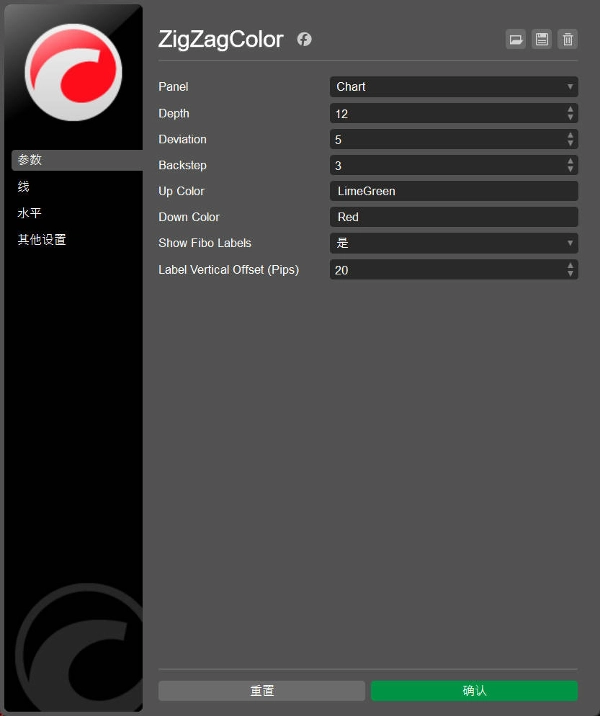
- Parameter Kunci
-
- Pergerakan Harga Minimum (%): Menentukan sensitivitas (misalnya, 5% mengabaikan pergerakan yang lebih kecil dari ini).
- Kedalaman Lookback: Mengontrol berapa banyak candle masa lalu yang dianalisis, memengaruhi keterlambatan.
Aplikasi Utama
1. Identifikasi Tren
- Uptrends: Higher highs (HH) + higher lows (HL).
- Downtrends: Lower highs (LH) + lower lows (LL).
- Membantu menggambar garis tren untuk potensi perdagangan breakout.
2. Pengenalan Pola
- Mengungkap pola grafik klasik (segitiga, bendera, baji) dengan mendefinisikan titik ayunan.
3. Level Retracement Fibonacci
- Menandai titik ayunan tinggi/rendah yang jelas untuk ekstensi Fibonacci atau retracement.
4. Deteksi Divergensi
- Menyoroti divergensi antara harga dan osilator (RSI, MACD).
Indikator ZigZag adalah alat untuk analisis teknikal yang terutama digunakan untuk mengidentifikasi titik pembalikan utama dalam tren harga, membantu trader menyaring kebisingan pasar dan menyoroti titik tertinggi dan terendah yang penting. Berikut adalah poin inti dan cara penggunaannya:
Prinsip Indikator ZigZag
- Fungsi Dasar:
-
- Dengan menetapkan ambang perubahan harga (persentase atau nilai tetap), secara otomatis mengabaikan fluktuasi kecil, hanya menghubungkan titik tinggi dan rendah yang signifikan, membentuk garis ZigZag.
- Sering digunakan untuk membantu mengidentifikasi level support/resistance, pembalikan tren (seperti pola head and shoulders, double bottom, dll).
- Parameter Inti:
-
- Amplitudo Minimum (misalnya 5% atau poin): Menentukan sensitivitas untuk menyaring fluktuasi kecil. Semakin besar nilainya, semakin sedikit sinyal tetapi lebih dapat diandalkan.
- Kedalaman Lookback: Mengontrol jumlah candle yang diperhitungkan, memengaruhi keterlambatan titik pembalikan.
Penggunaan Utama
- Identifikasi Tren:
-
- Menilai arah tren melalui peningkatan titik tinggi berturut-turut (tren naik) atau penurunan titik rendah (tren turun).
- Digabungkan dengan garis tren, dapat memprediksi breakout atau pullback lebih awal.
- Analisis Pola:
-
- Mengidentifikasi pola harga klasik (seperti segitiga, bendera), garis ZigZag dapat dengan jelas menunjukkan batas pola.
- Penggunaan Alat Fibonacci:
-
- Menggunakan titik tinggi/rendah yang ditandai oleh ZigZag sebagai titik awal/akhir untuk retracement atau ekstensi Fibonacci.
- Deteksi Divergensi:
-
- Saat harga dan indikator (seperti RSI, MACD) menunjukkan divergensi, ZigZag membantu mengonfirmasi titik awal dan akhir segmen divergensi.


