Deskripsi
Sesi oleh [BeyondTrading] — Ketahui ke mana pasar telah bergerak.
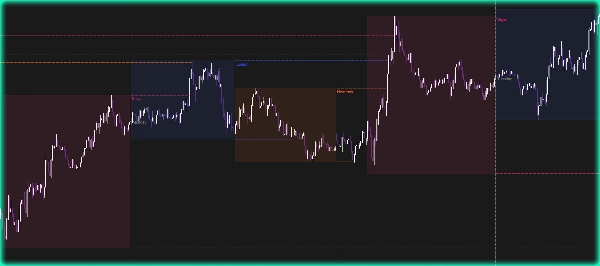
Visualisasikan 4 sesi perdagangan utama langsung di grafik Anda — New York, London, Tokyo, Sydney — sepenuhnya dapat disesuaikan dalam warna, waktu, dan transparansi. Setiap sesi menggambar kotak rentang langsung yang berkembang secara real time saat harga bergerak, sehingga Anda selalu tahu rentang yang sedang dibangun.
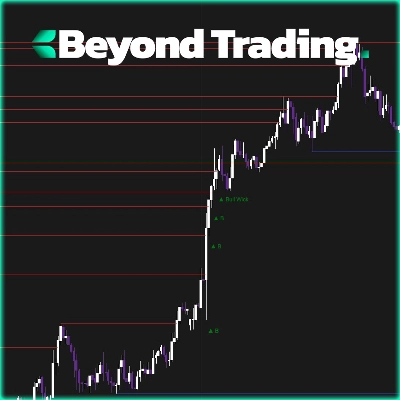
Saat sesi berakhir, High dan Low secara otomatis diproyeksikan ke depan sebagai garis putus-putus. Level-level ini tetap aktif sampai harga menembusnya — kemudian mereka berhenti. Tidak ada kekacauan, tidak ada tebakan. Anda melihat dengan tepat level mana yang masih aktif dan mana yang sudah ditembus.
Mengapa level High/Low sesi penting
High dan low sesi adalah kumpulan likuiditas utama. Institusi dan pembuat pasar secara konsisten kembali ke level ini untuk membalikkan arah atau mengambil likuiditas sebelum pergerakan nyata. High London sebelumnya bukan hanya sebuah garis — itu adalah tempat order stop berada, tempat trader breakout terjebak, dan tempat uang pintar berburu sebelum berbalik arah. Dengan perpanjangan otomatis dan deteksi breakout instan, Anda selalu tahu level mana yang masih aktif dan kemungkinan memicu reaksi.
Fitur
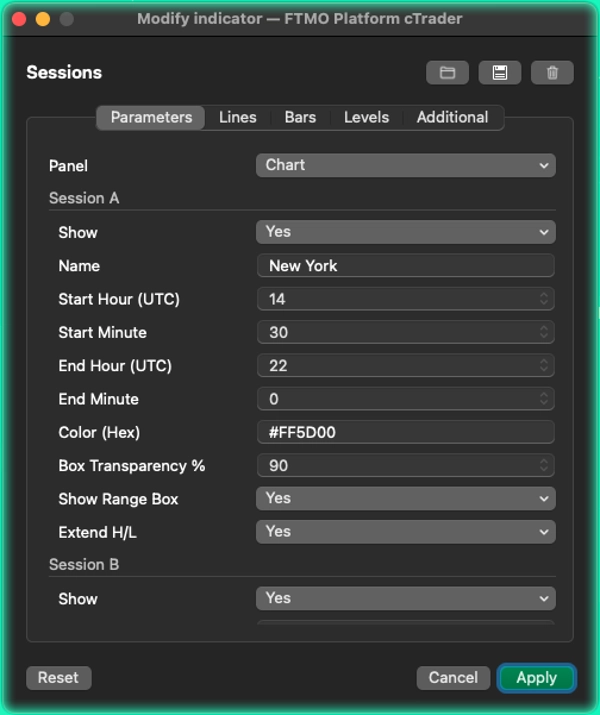
- 4 sesi yang sepenuhnya dapat dikonfigurasi dengan waktu mulai/akhir khusus, warna hex, dan transparansi.
- Kotak rentang langsung yang diperbarui pada setiap bar.
- High dan Low diproyeksikan ke depan setelah sesi berakhir, secara otomatis dihapus saat breakout.
- Level aktif maksimum yang dapat dikonfigurasi untuk menjaga grafik tetap bersih.
- Pembagi vertikal harian dengan label hari dalam minggu.
- Bekerja dengan sesi semalam seperti Sydney.
Ringkasan
After a session closes, the session's High and Low levels are automatically projected forward as dashed lines. These levels remain active until the price breaks through them, at which point they are removed, helping traders identify live breakout points without clutter. The indicator supports configurable maximum active levels to maintain chart clarity and includes a daily vertical divider labeled with the day of the week.
Designed to work with overnight sessions like Sydney, this tool highlights key liquidity zones where institutional traders often act. It is applicable across multiple markets including Forex, indices, commodities, cryptocurrencies, and stocks. The indicator aids in recognizing important breakout and reversal levels based on session highs and lows, facilitating informed trading decisions.
Diskusi
Ulasan pelanggan
5 | 100 % | |
4 | 0 % | |
3 | 0 % | |
2 | 0 % | |
1 | 0 % |