
Descrição
🌐 DOMINE O MERCADO COM A LEITURA DE FLUXO INSTITUCIONAL
O que mostra: negociações realmente executadas — fluxo real de agressão.
Vantagens: Este indicador é representado por dados de ticks.
Representa dinheiro que já foi comprometido no mercado.
Classifica os agressores (comprador/vendedor atinge o ask/bid).
Detecta absorção, exaustão, aceleração do fluxo.
📈Combine com os indicadores gratuitos, volume por preço, volume squeezer.
https://ctrader.com/products/2514 https://ctrader.com/products/2874
Fluxo de Ordens
Leitura de Fita
Escada DOM
Absorção Institucional
Rompimentos Inteligentes
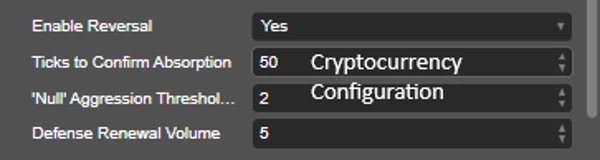
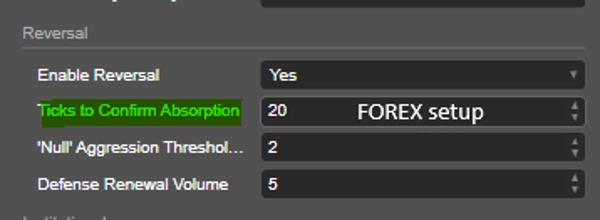
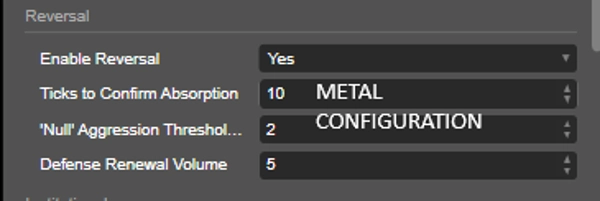
Reversões de Fluxo
Pressão de Compra e Venda
Análise de Agressão em Tempo Real
O sistema transforma o gráfico tradicional em um verdadeiro centro de leitura do mercado institucional.
DIFERENCIAL DO ALGORITMO
Enquanto indicadores comuns analisam apenas velas, o Tape Reading Scalper interpreta:
✅ Agressão real de compradores e vendedores
✅ Velocidade do fluxo
✅ Defesa institucional
✅ Absorção de ordens
✅ Aceleração da escada
✅ Rompimentos confirmados pelo fluxo
✅ Reversões por exaustão
✅ Pressão institucional vs. varejo
✅ Escalonamento inteligente de lotes
ESTRUTURA DO SISTEMA
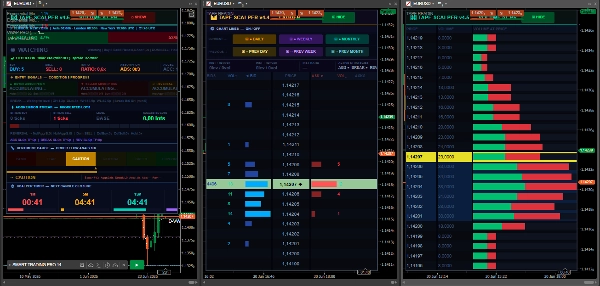
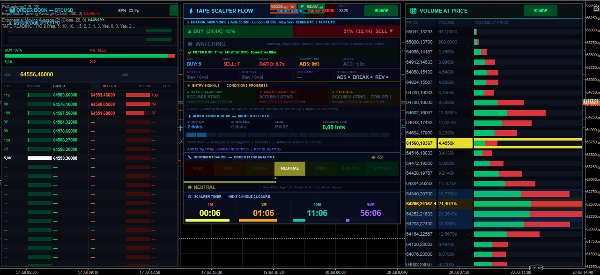
O algoritmo possui 2 painéis profissionais independentes:
⚡ PAINEL DE FLUXO (JANELA 1)
Painel responsável pela leitura operacional e geração de sinais.
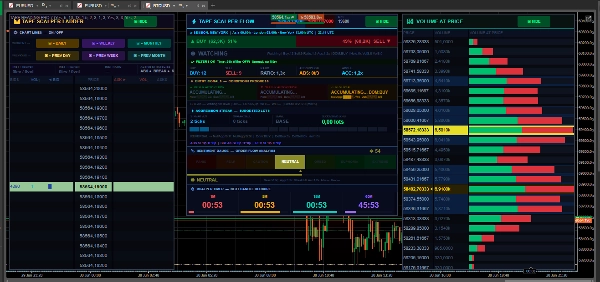
Exibe:
Fluxo Comprador/Vendedor
Absorção
Reversão
Rompimento
Sequência de Agressão
Sessões de Mercado
Relação Compra/Venda
Aceleração da Escada
SL/TP Dinâmicos
Filtros Operacionais
📊 PAINEL DA ESCADA (JANELA 2)
Painel institucional focado em:
Escada DOM
Níveis Institucionais
Volume por Preço
Pressão Institucional
POC
Faixa
Máximos/Mínimos Diários e Semanais
Livro de Preços
Calor Institucional
EXPLICAÇÃO DAS FUNÇÕES DA ESCADA
1. AGRESSÃO DE COMPRA
Mostra a agressão atual dos compradores.
Quando aumenta rapidamente:
Compradores estão entrando com força. O mercado pode acelerar para cima. Indica um possível rompimento.
Quanto maior o número:
➡ maior pressão de compra.
2. AGRESSÃO DE VENDA
Mostra a agressão dos vendedores.
Quando cresce rapidamente:
Vendedores dominando
Possível continuação da queda
Entrada institucional vendida
3. RAZÃO COMPRA/VENDA
Mostra a relação entre compradores e vendedores.
Exemplo:
Razão 2.0x = compradores dominam
Razão 3.0x = forte pressão institucional
Razão abaixo de 1.0 = vendedores dominando
Interpretação:
Interpretação da Razão
1.0 Equilíbrio
1.5 Pressão moderada
2.0+ Tendência forte
3.0+ Fluxo institucional forte
4. ABSORÇÃO
Uma das funções mais poderosas do algoritmo.
O sistema detecta quando:
Há um grande volume agressivo
Mas o preço NÃO está se movendo
Isso significa:
➡ Investidores institucionais absorvendo ordens.
ABSORÇÃO DE COMPRADOR
O mercado recebe muita venda, mas:
O preço para de cair. Surge defesa institucional. Possível reversão para compra.
Sinal:
▲ ABSORÇÃO DE COMPRADOR
ABSORÇÃO DE VENDEDOR
O mercado recebe muita compra, mas:
O preço não sobe. Vendedores seguram o movimento. Possível reversão para venda.
Sinal:
▼ ABSORÇÃO DE VENDEDOR
5. ACELERAÇÃO DA ESCADA
Mede a velocidade do fluxo no DOM.
O algoritmo compara:
Fluxo recente
vs. Fluxo anterior
Quando acelera:
➡ Provável entrada institucional.
Exemplo:
Valor Significado
1.0x Fluxo normal
1.5x Forte aceleração
2.0x+ Explosão institucional
6. DETECÇÃO DE ROMPIMENTO
Detecta rompimentos reais.
O sistema valida:
✅ Volume
✅ Agressão
✅ Velocidade
✅ Sequência
✅ Fluxo Institucional
✅ Aceleração da Escada
ROMPIMENTO DE COMPRA
Condições:
Forte agressão de compra Escada acelerando Pressão institucional Rompimento da máxima
Resultado:
➡ Entrada de compra validada.
ROMPIMENTO DE VENDA
Condições:
Forte pressão de venda Fluxo institucional vendedor Rompimento de suporte
Resultado:
➡ Venda confirmada.
7. DETECÇÃO DE REVERSÃO
Detecta reversões por exaustão.
O sistema identifica:
Agressão desaparecendo Defesa institucional surgindo Perda de força da tendência
Resultado:
➡ Reversão antecipada.
8. SISTEMA DE SEQUÊNCIA
Sistema inteligente de continuidade do fluxo.
Conta quantos ticks consecutivos ocorreram:
Compra contínua
ou
Venda contínua
NÍVEIS DE SEQUÊNCIA
Nível Significado
Nível 1 Tendência Inicial
Nível 2 Fluxo Forte
Nível 3 Movimento Explosivo
9. LOTES SUGERIDOS
O algoritmo sugere automaticamente:
aumento do tamanho do lote
redução do risco
escala operacional
Baseado em:
✅ Força do Fluxo
✅ Continuidade
✅ Intensidade Institucional
11. POC (PONTO DE CONTROLE)
Mostra o preço com o maior volume de negociação.
Importância:
Suporte/resistência forte
Zona institucional
Região de defesa
12. NÍVEIS DIÁRIOS/SEMANAL
Linhas automáticas para:
Máxima diária
Mínima diária
Máxima semanal
Mínima semanal
Usado para:
✅ Rompimentos
✅ Reversões
✅ Liquidez
✅ Ordens de stop-loss
13. FILTRO INSTITUCIONAL
Filtro institucional avançado.
Diferença:
Fluxo de Varejo
vs Fluxo Institucional
O sistema valida:
✅ Clusters Institucionais
✅ Volume por Nível
✅ Pressão Dominante
📈Use este indicador como confirmação para entrada em sua estratégia. Vale destacar a importância de analisar o fluxo, sinais de absorção, velocidade da fita e agressão em ticks, assim como o sentimento.
Resumo
Key functionalities include detection of institutional absorption (when large volume does not move price), breakout validation through volume and flow speed, reversal anticipation by exhaustion signals, and an intelligent streak system counting consecutive buy or sell ticks. The indicator also suggests lot sizing based on flow strength and institutional intensity, and applies an institutional filter distinguishing retail versus institutional flow.
Tape Reading 4.2 supports analysis of key market levels, real-time aggression, and flow reversals, transforming traditional charts into comprehensive institutional market reading tools. It is suitable for traders seeking detailed order flow insights and confirmation signals for entries based on market microstructure and volume dynamics.
Avaliações de clientes
5 | 50 % | |
4 | 50 % | |
3 | 0 % | |
2 | 0 % | |
1 | 0 % |


