Descrição
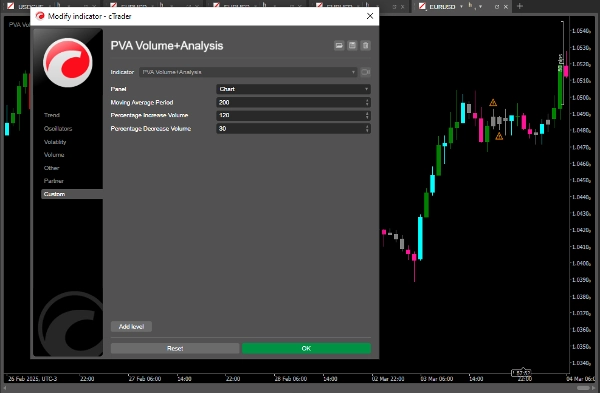
PVA (Análise Preço-Volume) é uma abordagem de análise técnica que estuda a relação entre o preço e o volume de negociação de um ativo financeiro. A ideia central por trás do PVA é que o volume de negociação pode fornecer informações importantes sobre a força e a direção de uma tendência, ajudando os traders a tomarem decisões mais informadas.
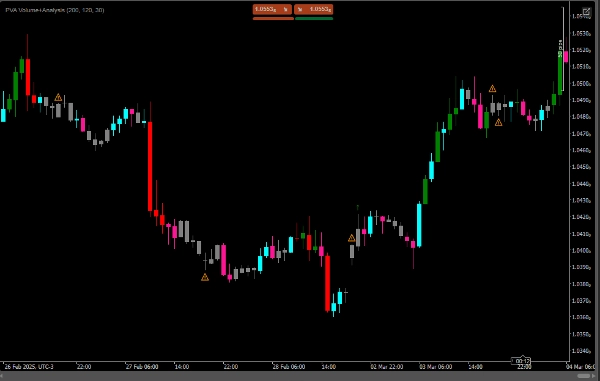
-Aumento do volume com alta no preço: Indica uma forte tendência de alta, e um símbolo verde (seta para cima) é exibido.
-Aumento do volume com queda no preço: Indica uma forte tendência de baixa, e um símbolo vermelho (seta para baixo) é exibido.
-Diminuição do volume com alta no preço: Indica que a tendência de alta pode estar perdendo força, e um alerta laranja (símbolo de aviso) é exibido.
-Diminuição do volume com queda no preço: Indica que a tendência de baixa pode estar perdendo força, e um alerta laranja (símbolo de aviso) também é exibido.
-Se o volume estiver caindo em um movimento ascendente ou descendente, uma marca de alerta (⚠️) é desenhada.
Resumo
- A green up arrow appears when volume increases alongside rising prices, indicating a strong uptrend.
- A red down arrow signals a strong downtrend when volume increases as prices fall.
- An orange warning symbol alerts when volume decreases during rising or falling prices, suggesting the current trend may be weakening.
- A general alert mark (⚠️) is displayed if volume declines during either upward or downward price movements.
This indicator assists traders by highlighting the interplay between price and volume, offering insights into the momentum behind market trends. It is designed for use in technical analysis to support more informed trading decisions.
Avaliações de clientes
5 | 100 % | |
4 | 0 % | |
3 | 0 % | |
2 | 0 % | |
1 | 0 % |