
Daily SD Levels - Indicator
Indicador
4 compras
Versão 1.0, Aug 2025
Windows, Mac
5.0
Avaliações: 1
Descrição
Níveis Diários de DP – Bandas Dinâmicas de Desvio Padrão Baseadas em VWAP
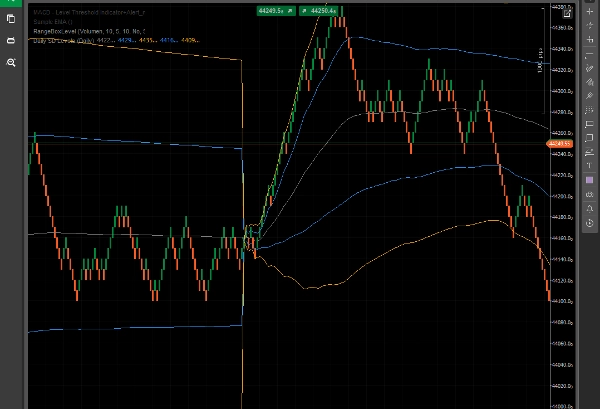
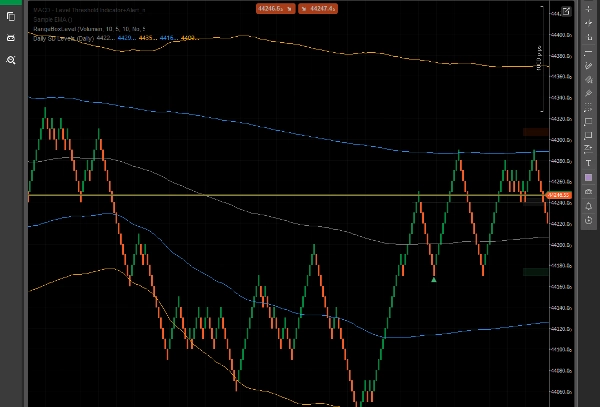
O indicador Níveis Diários de DP plota o VWAP (Preço Médio Ponderado por Volume) dinâmico e as Bandas de Desvio Padrão (+1/+2 e -1/-2) calculadas ao longo do dia de negociação atual.
Esta ferramenta ajuda os traders a avaliar visualmente a volatilidade intradiária, potenciais zonas de suporte/resistência e extremos de preço, tudo baseado no volume real do mercado e na ação do preço – não em níveis fixos ou arbitrários.
Principais Características:
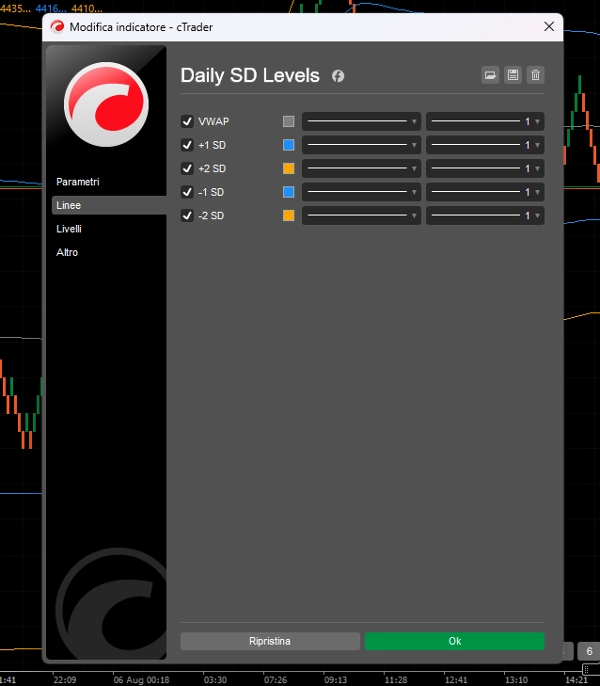
- Linha VWAP para acompanhamento do valor justo intradiário.
- Bandas de DP +1/+2 e -1/-2 para identificar zonas de sobrecompra/sobrevenda.
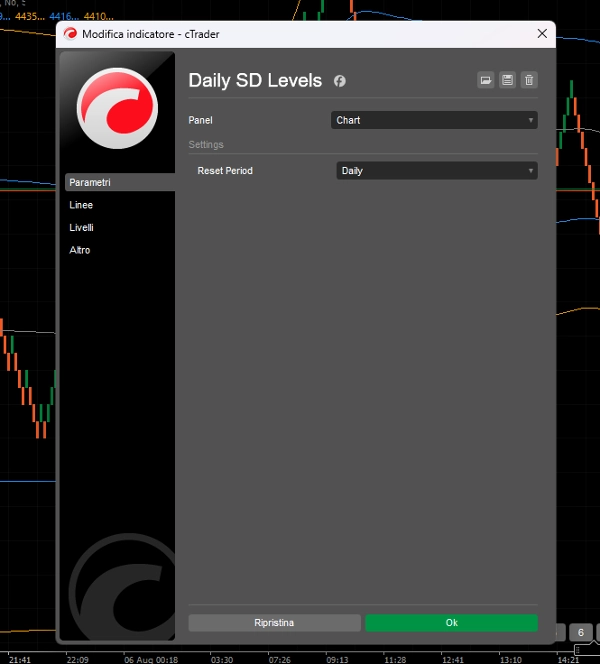
- Níveis reiniciados diariamente, adaptando-se à dinâmica de preço e volume de cada sessão.
- Otimizado para Renko, Range Bar e Negociação Intradiária.
- Construído para traders que precisam de clareza e zonas de preço dinâmicas.
Este indicador é perfeito para:
- Configurações de reversão à média.
- Identificação de movimentos estendidos para possíveis reversões.
- Confirmação visual de rompimentos além dos limites estatísticos.
Sem confusão. Apenas níveis limpos e responsivos que acompanham o mercado.
Resumo
Perfil do indicador
Avaliações de clientes
5.0
Avaliações: 1
5 | 100 % | |
4 | 0 % | |
3 | 0 % | |
2 | 0 % | |
1 | 0 % |
Avaliações de clientes
August 8, 2025
it gives context without making the decision, but the chart still needs a human read.
Conversa
Perguntas frequentes
Os produtos disponíveis através da cTrader Store, incluindo bots de negociação, indicadores e plugins, são fornecidos por programadores terceiros e são disponibilizados apenas para fins informativos e de acesso técnico. A cTrader Store não é um corretor e não fornece aconselhamento em matéria de investimento, recomendações pessoais ou qualquer garantia de desempenho no futuro.


Preço
Desde 16/07/2025
5
Vendas