
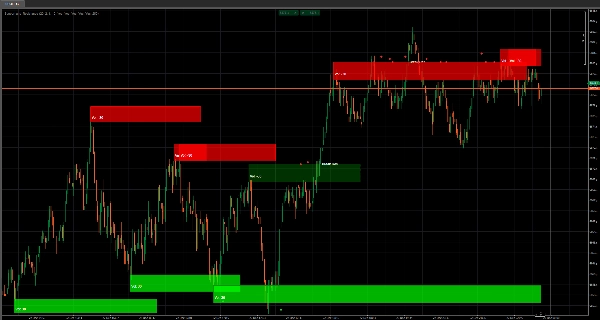
✅ Boîtes de Support & Résistance à Haut Volume — cartographie automatique des vraies zones de « défense / rupture »
✅ Force de Zone Pondérée par le Volume (opacité dynamique) — volume plus fort = présence de boîte plus forte
✅ Création de Zone Basée sur les Pivots (Lookback) — seuls les niveaux confirmés deviennent des zones (moins de bruit)
✅ Largeur de Boîte Adaptative (basée sur l'ATR) — les zones s'ajustent à la volatilité actuelle, pas à des estimations fixes
✅ Extension de Boîte en Direct — les zones continuent de se projeter à mesure que le prix évolue
✅ Intelligence Rupture / Maintien — détecte quand une zone tient ou casse et réagit instantanément
✅ Marques Visuelles d'Événements (Diamants) — confirmations claires de « maintien / inversion » sans complication
✅ Étiquettes de Rupture — événements clairs « Rupture Sup / Rupture Res » sur le graphique
✅ Contrôle Visuel Complet — bascules pour Boîtes / Texte de Volume / Diamants / Étiquettes de Rupture
✅ Système de Nettoyage Automatique — évite l'encombrement du graphique en supprimant automatiquement les anciennes marques d'événements
✅ Contrôle du Nombre Maximal de Boîtes — limite stricte pour garder la performance rapide et les graphiques lisibles
Support & Résistance (Boîtes à Haut Volume) n'est pas un outil S/R basique qui génère des lignes aléatoires.
Cet indicateur est conçu pour vous montrer quelque chose de bien plus précieux :
Où le prix a créé un véritable intérêt — et où il est le plus susceptible de réagir à nouveau.
Au lieu de dessiner des « niveaux jolis », il construit des zones d'offre et de demande à haut volume sous forme de boîtes directement sur votre graphique, pour que vous puissiez trader la structure comme un professionnel :
identifier la zone → observer la réaction → trader le maintien ou la rupture.
L'Avantage Principal : Volume + Structure, pas de suppositions
Chaque boîte est créée uniquement lorsque deux conditions sont réunies :
- Un pivot confirmé (la structure compte)
- Un extrême de volume (l'intérêt compte)
Cela signifie que vous ne recevez pas de zones faibles en spam.
Vous obtenez moins de zones — mais celles que vous obtenez sont celles qui comptent vraiment.
Force Visible (Opacité = Puissance)
C'est là que cela devient injuste pour ceux qui tradent le S/R « à l'aveugle ».
L'opacité de remplissage des boîtes varie avec le volume, vous savez donc instantanément :
- Boîte pâle = intérêt faible (surveillez-la)
- Boîte forte = intérêt élevé (respectez-la)
Pas d'indicateurs supplémentaires, pas de gymnastique d'interprétation — c'est littéralement visible.
Zones Adaptatives à la Volatilité (Largeur ATR)
Les marchés ne bougent pas de la même manière chaque jour.
Cet indicateur adapte l'épaisseur des boîtes en utilisant une base ATR longue, de sorte que les zones s'élargissent ou se resserrent avec la volatilité.
Résultat :
les zones restent réalistes au lieu d'être trop fines pour être pertinentes ou trop larges pour être utiles.
Intelligence Maintien vs Rupture (et Retour Visuel Instantané)
Une zone n'a de valeur que si vous pouvez lire ce que le prix en fait.
Cet indicateur suit :
- Maintiens (rejet / respect)
- Ruptures (acceptation à travers la zone)
…puis met à jour le style en direct :
- Les maintiens conservent l’« identité support/résistance » originale
- Les ruptures inversent le comportement (le support peut devenir résistance et vice versa)
- Le style de rupture peut passer en pointillé + nouvelle teinte de couleur pour que vous sachiez instantanément :
« Ce niveau vient de changer de caractère. »
Diamants + Étiquettes de Rupture : Déclencheurs de décision clairs
Vous obtenez des marqueurs d'événements simples et à fort signal :
- Diamants pour mettre en évidence les événements de maintien/inversion
- Étiquettes de rupture pour ne jamais manquer le moment où un niveau cède
C’est la différence entre penser qu’une rupture s’est produite… et savoir qu’elle s’est produite.
Conçu pour le Trading Réel : Contrôle + Graphiques Propres
Cet indicateur a été conçu pour rester utilisable après des heures de trading :
- Vous voulez seulement des zones ? Désactivez les diamants/étiquettes.
- Vous voulez des signaux purs ? Désactivez le texte de volume.
- Vous voulez de la performance ? Limitez Max Boxes.
- Vous détestez l’encombrement ? Auto-Clean Events garde le graphique net en supprimant automatiquement les anciennes marques.
Vous restez concentré sur la bataille actuelle — pas noyé dans l’histoire.
Configuration Recommandée (Démarrage Rapide)
✅ Période de Lookback : 20 (confirmation équilibrée)
✅ Longueur du Filtre de Volume : 2 (réactif)
✅ Multiplicateur de Largeur de Boîte : 1.0 (neutre)
✅ Afficher les Boîtes : ON
✅ Diamants + Étiquettes de Rupture : ON (jusqu’à ce que vous compreniez le comportement, puis affinez)
✅ Événements Auto-Clean : ON (gardez-le propre)
Ce que cet indicateur vous offre vraiment
Une carte visuelle de là où le marché a montré ses cartes — et une lecture en direct pour savoir si le prix respecte cette zone ou la détruit.
Si vous tradez les ruptures, les retracements, les retournements ou les retests :
cela devient votre « superposition de champ de bataille ».


