
Mô tả
WICK COMMANDER — Biết Chính Xác Khi Thị Trường Cam Kết
Hầu hết các nhà giao dịch xem nến. Wick Commander xem ý định.
Mỗi cây nến kể một câu chuyện — nhưng chính đóng cửa mới tiết lộ sự thật. Wick Commander theo dõi mức cao và thấp của cây nến trước đó và chờ giá đóng cửa vượt ra ngoài phạm vi đó với sự quyết đoán. Không có bẫy bấc. Không có tiếng ồn. Chỉ có các đột phá được xác nhận dựa trên đóng cửa nến đầy đủ.
CÁCH HOẠT ĐỘNG
Logic rất sắc bén:
Một tín hiệu MUA được kích hoạt khi một cây nến tăng đóng cửa trên mức cao của cây nến trước đó — giá không chỉ chạm qua, mà đã cam kết. Một tín hiệu BÁN được kích hoạt khi một cây nến giảm đóng cửa dưới mức thấp của cây nến trước đó — người bán đã hoàn toàn kiểm soát.
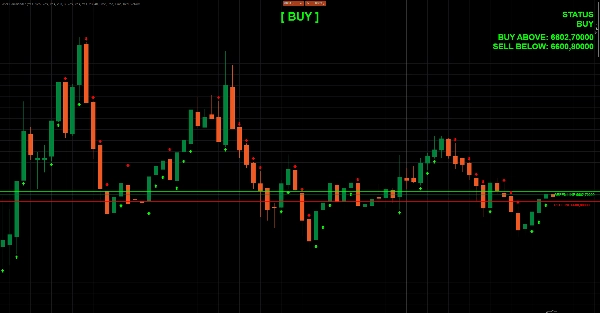
Hai đường động cập nhật theo thời gian thực trên biểu đồ của bạn. Đường màu xanh lá đánh dấu mức đột phá lên trên. Đường màu đỏ đánh dấu mức phá vỡ xuống dưới. Khi giá đóng cửa vượt ra ngoài một trong hai đường với hướng nến đúng, mũi tên sẽ xuất hiện và bảng điều khiển cập nhật ngay lập tức.
NHỮNG GÌ BẠN THẤY TRÊN BIỂU ĐỒ
- 🟢 Đường màu xanh lá — ngưỡng mua trực tiếp (mức cao của cây nến trước)
- 🔴 Đường màu đỏ — ngưỡng bán trực tiếp (mức thấp của cây nến trước)
- ⬆️ Mũi tên mua — in dưới cây nến tín hiệu trên các đột phá tăng được xác nhận
- ⬇️ Mũi tên bán — in trên cây nến tín hiệu trên các phá vỡ giảm được xác nhận
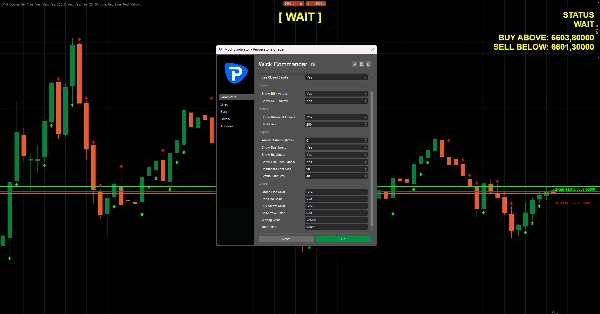
- 📊 Bảng điều khiển — hiển thị trạng thái hiện tại (MUA / BÁN / CHỜ), giá kích hoạt chính xác, và cập nhật mỗi thanh
- 🔵 Màn hình trạng thái lớn — nhãn lớn ở giữa hiển thị xu hướng thị trường hiện tại ngay lập tức
- 🕓 Quét lịch sử đầy đủ — xem lại lên đến 5000 thanh để bạn có thể ngay lập tức xác thực chất lượng tín hiệu trên công cụ và khung thời gian của mình
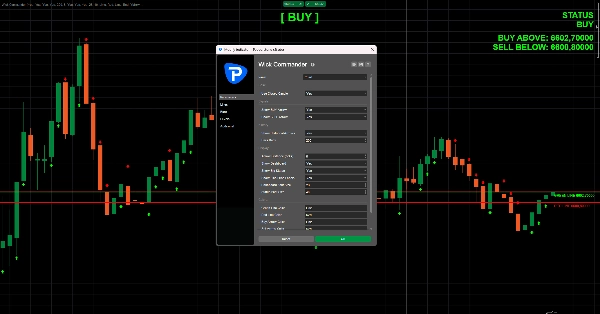
TÍNH NĂNG
- Hoạt động trên mọi khung thời gian và mọi công cụ
- Chuyển đổi giữa xác nhận nến đóng và chế độ nến trực tiếp
- Kiểm soát hoàn toàn khoảng cách mũi tên, màu sắc, kích thước phông chữ và các yếu tố hiển thị
- Chồng tín hiệu lịch sử để kiểm tra lại ngay trên biểu đồ
- Logic sạch, không vẽ lại — tín hiệu dựa trên nến đóng (khi chế độ xác nhận được bật)
- Không cần dữ liệu bên ngoài, không cần internet —
AccessRights.None, hoàn toàn tương thích với Store
AI PHÙ HỢP VỚI CÔNG CỤ NÀY?
Các nhà giao dịch đột phá, nhà giao dịch động lượng, và bất kỳ ai mệt mỏi với các phá vỡ bấc giả. Nếu bạn muốn một tín hiệu sạch, dựa trên quy tắc chỉ kích hoạt khi cây nến thực sự đóng cửa vượt ra ngoài phạm vi trước đó — Wick Commander là công cụ dành cho bạn.
Quy tắc đơn giản. Hình ảnh rõ ràng. Không phải đoán già đoán non.
Hãy làm chủ bấc nến.
Tóm tắt
Key features include:
- Real-time dynamic lines on the chart: a green line marking the previous candle’s high (buy threshold) and a red line marking the previous candle’s low (sell threshold).
- Buy signals trigger when a bullish candle closes above the previous high; sell signals trigger when a bearish candle closes below the previous low.
- Visual cues include arrows indicating buy or sell signals and a dashboard panel displaying current market status (BUY, SELL, WAIT) with exact trigger prices.
- A large status display provides an at-a-glance market bias.
- Historical signal overlay allows backtesting up to 5000 bars.
- Customizable display options for arrow distance, colors, and fonts.
- Operates on any timeframe and instrument without external data or internet connection.
- Supports toggle between closed-candle confirmation and live-candle mode with zero repaint logic when confirmation mode is enabled.
Wick Commander is suited for breakout and momentum traders seeking clear, rules-based signals based on candle close confirmations across markets including forex, indices, commodities, stocks, and cryptocurrencies.


