Descrição
O indicador MAGIC BLOCK STRATEGY combina duas abordagens principais para análise de mercado:
Detecção de Bloco de Ordem:
Identifica áreas de suporte e resistência com base em máximas e mínimas não quebradas dentro de um período de análise.
Gera sinais de compra quando o preço fecha acima de uma mínima não quebrada.
Gera sinais de venda quando o preço fecha abaixo de uma máxima não quebrada.
Análise de Liquidez:
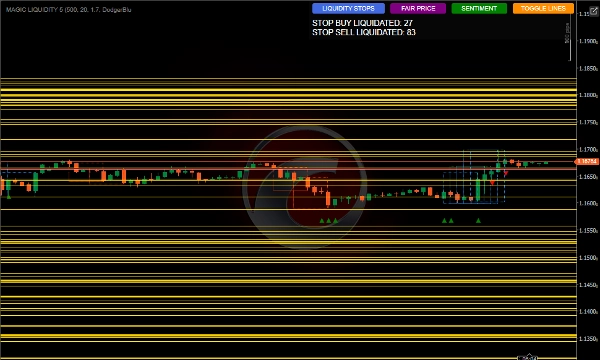
Detecta áreas de pools de liquidez onde podem estar concentradas ordens de stop loss.
Monitora a ativação de stops de compra e venda.
Calcula o sentimento do mercado com base na distribuição de liquidez.
Identifica o preço justo mais negociado.
Como Usar para Melhores Resultados
Configuração Inicial
Período de Análise: Ajuste o parâmetro Período de Análise de acordo com o timeframe que você está negociando — valores maiores para timeframes maiores.
Número de Velas para Análise: Mantenha em 500 para uma análise robusta ou reduza para reações mais rápidas.
Cor do Pool de Liquidez: Escolha uma cor que se destaque no seu gráfico.
Interpretação dos Sinais
Sinais de Bloco de Ordem:
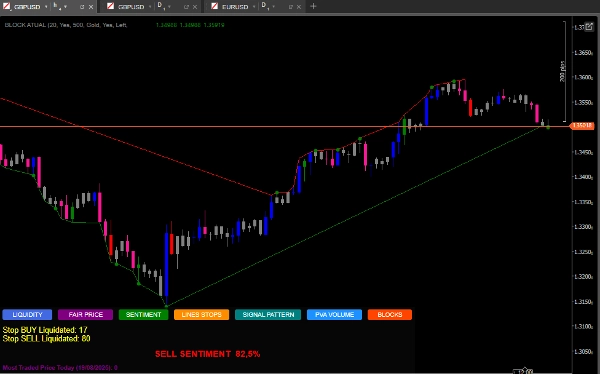
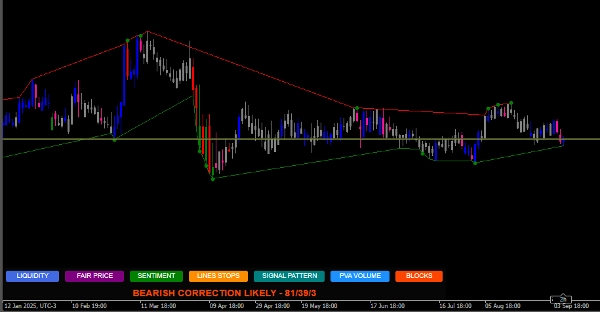
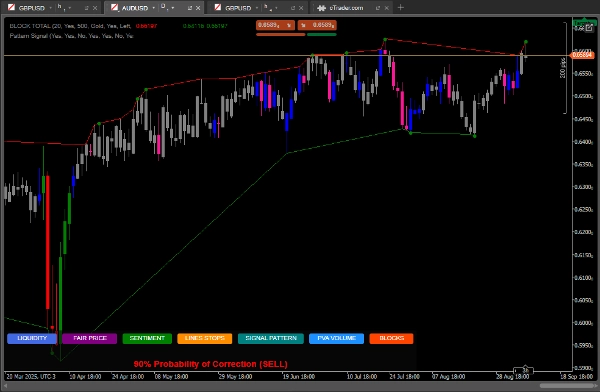
Pontos verdes: sinais de compra quando o preço fecha acima de uma mínima não quebrada.
Pontos vermelhos: sinais de venda quando o preço fecha abaixo de uma máxima não quebrada.
Pools de Liquidez:
Linhas horizontais mostram áreas de liquidez, potenciais alvos ou pontos de reversão.
Monitore a relação entre a liquidez acima/abaixo do preço atual.
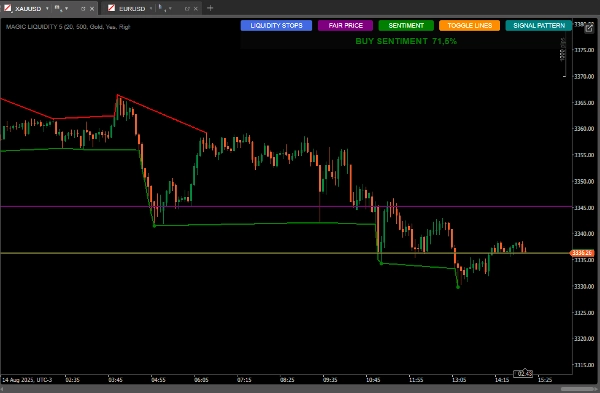
Sentimento de Mercado:
Use o botão SENTIMENT para ver a direção predominante e a confiança.
Sentimento de compra com alta confiança sugere crescimento contínuo. Sentimento de venda com alta confiança sugere continuação de baixa.
Padrões de Candlestick:
O botão SIGNAL PATTERN analisa e
Mostra probabilidades de correção com base na relação quantitativa
Preço Justo Mais Negociado:
O botão PRICE mostra o nível de preço com maior volume do dia.
Pode atuar como um ímã para os preços ou como suporte/resistência.
Estratégias de Uso
Estratégia Conservadora:
Negocie apenas quando os sinais do bloco de ordem coincidirem com o sentimento predominante.
Use pools de liquidez como alvos de take-profit.
Estratégia Agressiva:
Antecipe reversões quando o preço se aproximar de pools de liquidez com muitos stops acumulados.
Use divergências entre sentimento e ação do preço para negociações contra a tendência.
Confirmação Adicional:
Compare com o padrão de candlestick mostrado pelo indicador.
Verifique se o preço justo está próximo como uma área de interesse.
Gestão de Risco.
Stop-Loss:
Coloque abaixo do bloco de ordem mais recente para compras
Coloque acima do bloco de ordem mais recente para vendas
Take-Profit:
Alvos em pools de liquidez próximos
Considere a relação de liquidez acima/abaixo para definir alvos
Dicas Avançadas
Use o botão TOGGLE LINES para desativar as linhas de liquidez quando o gráfico ficar poluído
Monitore a contagem de stops liquidados para avaliar a força do movimento
O preço justo é especialmente útil em mercados laterais, como suporte/resistência dinâmicos
Combine com outros indicadores para confirmação volume, médias móveis
SIGNAL PATTERN DISPONÍVEL NO TIMEFRAME D1.
https://ctrader.com/pt/products/1725?u=Goulart
https://ctrader.com/pt/products/1386?u=Goulart
Resumo
The indicator also analyzes liquidity pools, highlighting areas where stop losses may accumulate and monitoring the activation of buy and sell stops. It calculates market sentiment based on liquidity distribution and identifies the most traded price level of the day, which can act as dynamic support or resistance.
Users can customize parameters such as lookback period and number of candles for analysis to suit different timeframes and trading styles. Visual signals include green and red dots for buy and sell order block signals, horizontal lines for liquidity pools, and sentiment indicators showing prevailing market direction and confidence.
The tool supports conservative strategies that align order block signals with sentiment and use liquidity pools as profit targets, as well as aggressive strategies that anticipate reversals near liquidity pools and exploit divergences between sentiment and price action. Additional features include candlestick pattern correction probabilities and options to toggle liquidity lines for chart clarity. Risk management guidance suggests placing stop-loss orders relative to recent order blocks and setting take-profit targets near liquidity pools.