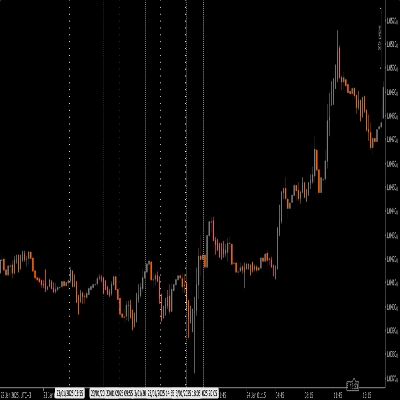
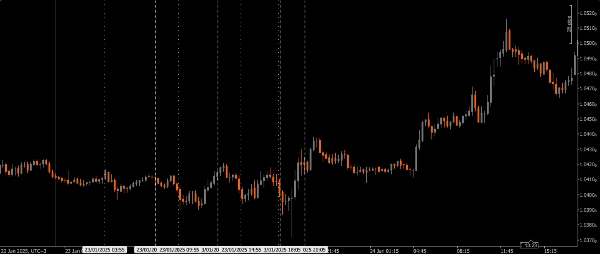
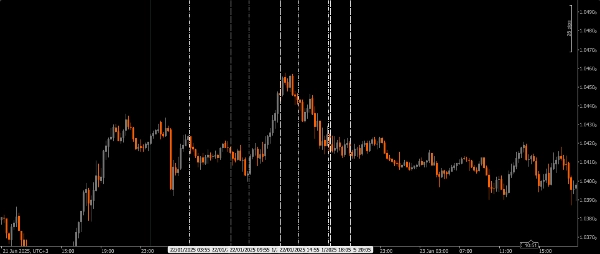
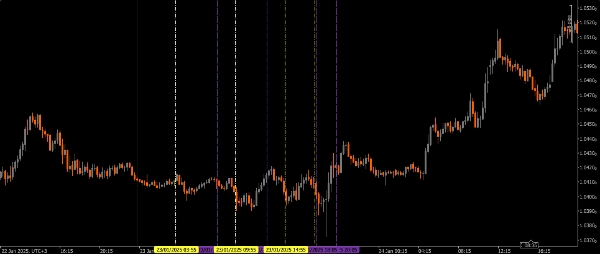
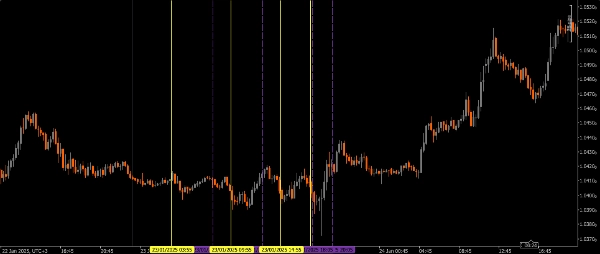
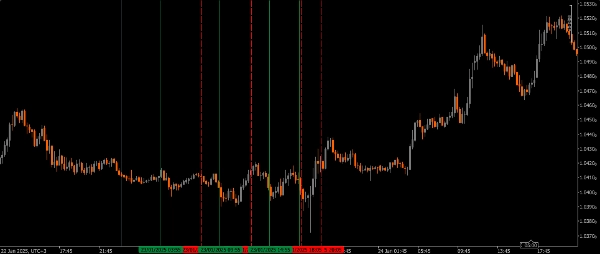
Corretores e props
Para empresas
00
Days
:
00
Hours
:
00
Minutes
:
00
Seconds
Killzone_Tidypips
Indicador
211 transferências
Version 1.0, Jan 2025
Windows, Mac
4.0
Avaliações: 1
Desde 19/11/2024
Vendas
15
Instalações gratuitas
3699
Imagem carregada de "Killzone_Tidypips"Imagem carregada de "Killzone_Tidypips"Imagem carregada de "Killzone_Tidypips"Imagem carregada de "Killzone_Tidypips"Imagem carregada de "Killzone_Tidypips"
4.0
Avaliações: 1
5
0 %
4
100 %
3
0 %
2
0 %
1
0 %
Avaliações de clientes
August 12, 2025
Pros: Visual session zones, customizable, great for ICT strategies. Cons: No alerts, no per-session toggle, possible chart clutter.

Mais deste autor

ICT Killzone and Sessions high_low
This indicator is an essential tool for traders seeking to visualize key trading sessions on their charts.
Indicador
XAUUSD
Commodities
FVG_tidypips
A Fair Value Gap (FVG) indicator that identifies potential price imbalances, potential reversal and continuation zones
Previous Day Liquidity Zones (PDH - PDL)
Useful indicator for traders who want to visualize key price levels based on previous daily highs and lows.
Daily Open Pivot Level
This indicator is a valuable tool for traders looking to identify significant opening price level of any asset.
Moving Average channel
This indicator is designed to display customizable moving averages (MAs) on a chart.
Weekly Expansion (Premium_Discount Pivots)
Very handy tool for traders looking to visualize previous days premium and discount price levels.
Drawing Utility
A rectangular box with 5 adjustable Fibonacci level or even custom ones.
Indicador
XAUUSD
Commodities
True Open Pivot Levels
This indicatorFull Description: Th shows the open price lines at key market times based on Eastern Standard Time (EST).
Previous Day Equilibrium (Premium & Discount)
Plots the equilibrium price levels based on previous daily highs and lows.

Também poderá gostar de

IR Macd on Chart
this indicator show macd on chart.
Indicador
NAS100
NZDUSD
Martingale
+26
Trend & Volume Regime Map
Trend & Volume Regime Map – A normalized price & volume regime map for cTrader that scores trend from –10 to +10, colors
Indicador
RSI
Breakout
Supertrend
Market Trend OB
Price action to detect when the market changes trend (MSB) and defines, order blocks , ZigZag etc.📊
MA Sabres
Conquer the markets with MA Sabres! This indicator spots trend flips with MAs and cool Sabre shapes & alerts.
Indicador
NZDUSD
Breakout
XAUUSD
+7
Support Resistance
Utilize support and resistance levels across various timeframes, including large, range, and tick charts
Candle Timer & Strength
Candle Timer & Strength for cTrader Description: Candle Timer & Strength is a powerful and intuitive indicator for cTrad
Indicador
RSI
Commodities
Signal
+1
Dot Momentum %BB Indicator
Dynamic circles visualize price's volatility position. Like RSI for market overextension & stretch. Quantify context.
Indicador
RSI
Breakout
ATR
+2
Channel Breakout System
🚀 Specialized algorithm is designed to confirm entry and exit points with precision 🎯
Indicador
RSI
XAUUSD
Breakout
+5
Channel Price Predictor
🔮Channel Price Predictor: Anticipates future price zones with trend channels based on volatility and projections." 📈
Indicador
RSI
Indices
StochasticRSI
Stochastic RSI (StochRSI) is a technical indicator used to measure the strength and weakness of the RSI.
Indicador
RSI
XAUUSD
Breakout
+5
Prime Trend Targets
PrimeTrend: ATR trendline detects reversals, plots entry/SL/3 targets. Tune params (speed vs. robustness). Backtest +
Open Trade ProfitV1
A simple indicator that tracks the value of your open trades in pips.