
*CZASY OTWARCIA BĘDĄ RÓŻNIĆ SIĘ W ZALEŻNOŚCI OD KLAS AKTYWÓW
*DOMYŚLNE WARTOŚCI CZASU DOTYCZĄ NQ/ES/YM (FUTURES)
*WARTOŚĆ CZASU POWINNA BYĆ W CZASIE STANDARDOWYM WSCHODNIM (EST)
Kluczowe cechy:
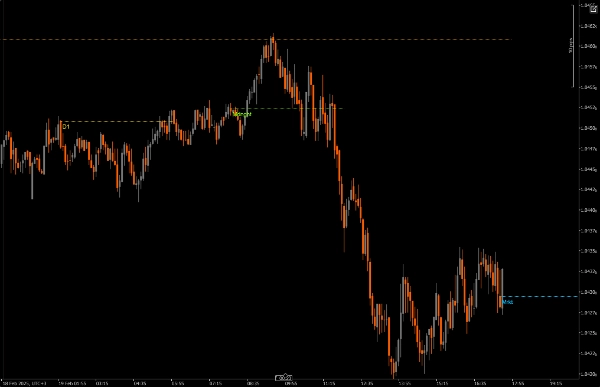
Poziomy cen oparte na czasie
Rysuje linie cen otwarcia w kluczowych godzinach rynkowych
Wszystkie czasy są zsynchronizowane z czasem standardowym wschodnim (EST)
Każdy okres czasu jest oznaczony kolorem dla łatwej identyfikacji
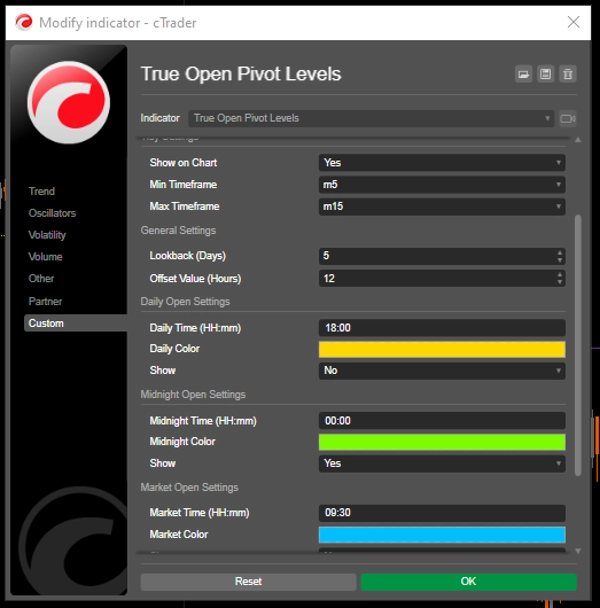
3 konfigurowalne markery sesji:
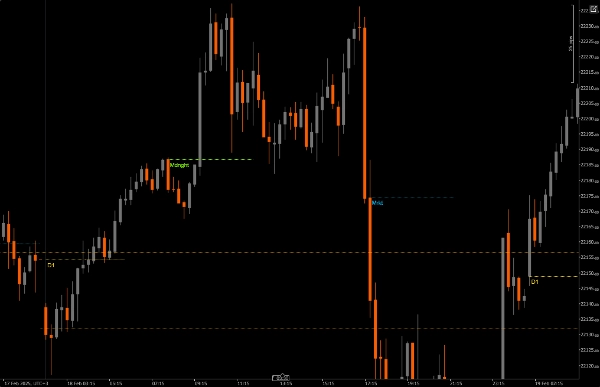
Otwarcie dzienne (12:00 AM EST) - domyślny złoty
Otwarcie o północy (4:00 AM EST) - domyślny zielony
Otwarcie rynku (9:30 AM EST) - domyślny niebieski
Każdą sesję można niezależnie włączać/wyłączać
Personalizacja wizualna:
Regulowana grubość linii
Wiele stylów linii (ciągła, kropkowana, kreskowana)
Konfigurowalne kolory dla każdej sesji
Opcjonalne etykiety czasu pokazujące czasy EST
Przesunięcie linii konfigurowalne do 48 godzin
Obsługa elastycznych ram czasowych:
Ustaw minimalne i maksymalne ramy czasowe do wyświetlania
Zapobiega zaśmiecaniu wykresu na nieodpowiednich ramach czasowych
Optymalizowane dla ram czasowych M5-M15
Ustawienia czasu:
Wszystkie czasy są w EST
Dostosuj czasy sesji do swojej strategii handlowej
Dostosuj czas trwania linii w zależności od potrzeb analizy
Ustawienia wizualne:
Dostosuj grubość linii dla lepszej widoczności
Wybierz styl linii w zależności od czytelności wykresu
Włącz/wyłącz etykiety według potrzeb
Dostosuj kolory do motywu wykresu
Ustawienia ogólne:
Zdefiniuj minimalne/maksymalne ramy czasowe
Dostosuj czas trwania linii dla rozszerzonej analizy
Najlepsze praktyki:
Zacznij od ustawień domyślnych i dostosuj je według potrzeb
Używaj różnych kolorów dla każdej sesji dla wyraźnego rozróżnienia
Rozważ skrócenie czasu trwania linii na niższych ramach czasowych, aby uniknąć zaśmiecenia
Początkowo włącz etykiety, aby zrozumieć czas, wyłącz je, jeśli wykres stanie się zbyt zatłoczony
Dopasuj ustawienia ram czasowych wskaźnika do swojej ramy czasowej handlu
Ten wskaźnik jest szczególnie przydatny dla:
Traderów dziennych koncentrujących się na rynkach USA
Traderów, którzy muszą śledzić otwarcia sesji
Osób handlujących wokół ważnych wydarzeń rynkowych
Traderów analizujących akcję cenową w wielu sesjach
Każdego, kto potrzebuje wyraźnego wizualnego odniesienia do czasów rynkowych EST
5 | 100 % | |
4 | 0 % | |
3 | 0 % | |
2 | 0 % | |
1 | 0 % |


