
VIX - volatility indicator
Wskaźnik
2 zakupy
Wersja 1.2, Apr 2026
Windows, Mac
4.5
Opinie: 2
Opis
Ten autorski wskaźnik VIX, oparty na Average True Range (ATR), dostarcza precyzyjną i czystą analizę zmienności rynku, zoptymalizowaną dla cTrader 5.5.13+. Łączy skalowany ruch VIX z analizą wolumenu, aby potwierdzić główne zmiany i potencjalne wybicia.
Kluczowe cechy i jakość kodu
- Brak błędów/ostrzeżeń: Całkowicie przepisany do najnowszego API cTrader, eliminując wszystkie błędy i ostrzeżenia z poprzednich wersji dla maksymalnej stabilności i wydajności.
- VIX oparty na ATR: Zapewnia responsywną miarę zmienności, znormalizowaną do ekstremalnych warunków rynkowych.
- Podwójne potwierdzenie: Wykorzystuje zmienność (linia VIX) w połączeniu z danymi o wolumenie Tick, aby zweryfikować sygnały wybicia o wysokim prawdopodobieństwie.
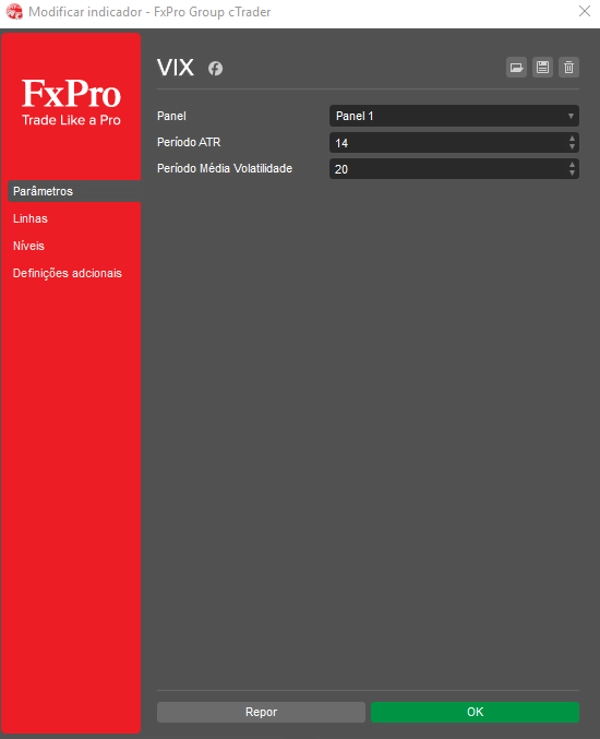
Dostosuj ustawienia dla maksymalnej wiedzy
Łatwo dostrój wskaźnik do swojej strategii handlowej, ustawiając pożądane wartości dla Niskiego poziomu VIX oraz Wysokiego poziomu VIX. Dodatkowo, dostosuj Współczynnik skali VIX, aby precyzyjnie kontrolować wysokość i wizualizację linii VIX w dolnym panelu.
Jak odczytywać sygnały wybicia i konsolidacji
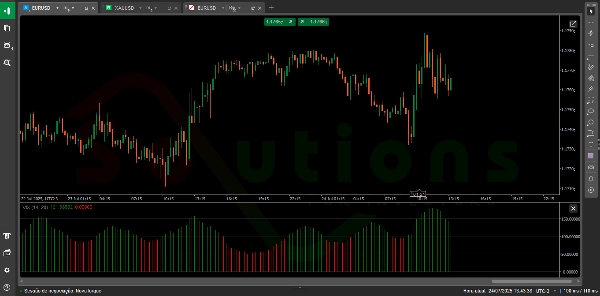
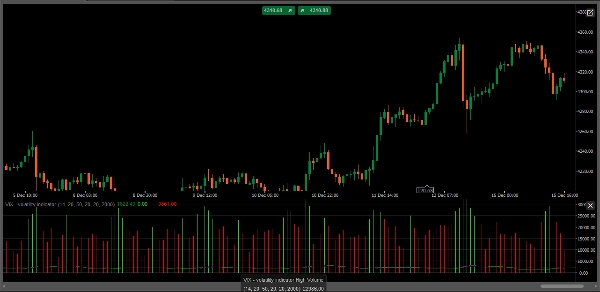
- Sygnał wybicia (wysoka zmienność): Gdy linia VIX mocno przebija się powyżej Wysokiego poziomu VIX ORAZ towarzyszy temu wysoki wolumen (wskazany przez histogram Wysokiego wolumenu), potwierdza to ekstremalny strach/chciwość i sygnalizuje wybicie rynku o wysokim prawdopodobieństwie.
- Sygnał konsolidacji (niska zmienność): Gdy linia VIX spada poniżej Niskiego poziomu VIX, często wskazuje to na okres spokoju na rynku, ścisłej konsolidacji lub potencjalnego powrotu do średniej — idealne do przygotowania kolejnego ruchu lub zmniejszenia ryzyka.
- Wgląd w wolumen: Wskaźnik rysuje histogramy Wysokiego wolumenu (zielony) i Niskiego wolumenu (czerwony) w tle, pozwalając natychmiast ocenić płynność i przekonanie stojące za aktualną akcją cenową.
Podsumowanie
Podsumowanie AI
The VIX - Volatility Indicator is a proprietary tool designed for the cTrader platform (version 5.5.13 and above) that measures market volatility using an Average True Range (ATR)-based approach. It combines a scaled VIX line with tick volume data to provide dual confirmation of market conditions, helping traders identify potential breakouts and consolidation phases.
Key features include:
- ATR-based VIX calculation for responsive volatility measurement normalized to detect extreme market conditions.
- Volume analysis with high (green) and low (red) volume histograms to assess liquidity and conviction behind price movements.
- Customizable parameters allowing users to set Low VIX Level and High VIX Level thresholds, as well as adjust the VIX Scale Factor for optimal visualization.
Usage signals:
- A breakout alert occurs when the VIX line surpasses the High VIX Level accompanied by high volume, indicating potential market breakouts driven by extreme fear or greed.
- A consolidation signal is identified when the VIX falls below the Low VIX Level, suggesting periods of low volatility, market calm, or potential mean reversion.
This indicator supports analysis across various markets including Forex, indices, commodities, stocks, and cryptocurrencies.
Profil wskaźnika
Opinie klientów
4.5
Opinie: 2
5 | 50 % | |
4 | 50 % | |
3 | 0 % | |
2 | 0 % | |
1 | 0 % |
Opinie klientów
March 6, 2025
ngl, breaks are easier to judge and that is enough to keep testing it. It is not the whole trading plan.
February 28, 2025
reads better when the chart already supports the idea. Spread and slippage need a line in the notes.
Dyskusja
Częste pytania
BTCUSD
Forex
Signal
Breakout
Indices
EURUSD
Commodities
GBPUSD
NZDUSD
Prop
Crypto
Stocks
XAUUSD
NAS100
USDJPY
Produkty dostępne za pośrednictwem cTrader Store, w tym boty handlowe, wskaźniki i wtyczki, dostarczane są przez deweloperów zewnętrznych i udostępniane wyłącznie w celach informacyjnych oraz w celu zapewnienia dostępu technicznego. cTrader Store nie jest brokerem i nie zapewnia doradztwa inwestycyjnego, nie udziela spersonalizowanych rekomendacji ani nie gwarantuje przyszłych wyników.


Cena
Od 05/02/2025
31
Sprzedaż