
Opis
Niestandardowy RSI – Precyzyjne odwrócenia na rynku spot z czytelną wizualizacją
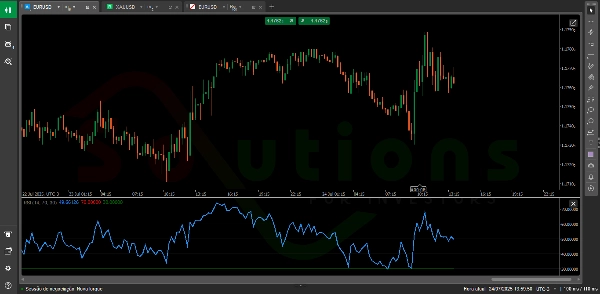
Niestandardowy RSI to ulepszona wersja klasycznego Relative Strength Index (RSI), zaprojektowana, aby pomóc traderom szybko identyfikować strefy wykupienia i wyprzedania—kluczowe obszary, gdzie cena prawdopodobnie się odwróci.
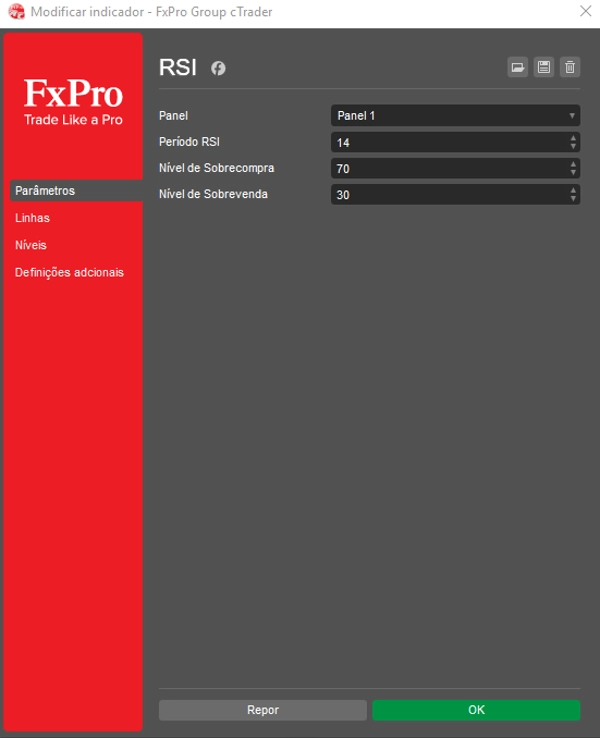
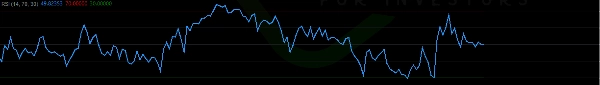
Dzięki czystemu i intuicyjnemu interfejsowi wyświetla dwie w pełni konfigurowalne linie poziome (jak tradycyjne poziomy 70 i 30), wyraźnie zaznaczając na wykresie punkty decyzyjne o wysokim prawdopodobieństwie.
✅ Dopasuj ramy czasowe i poziomy RSI do swojego stylu handlu
✅ Zidentyfikuj potencjalne strefy odwrócenia z większą pewnością
✅ Ulepsz swoją analizę techniczną dzięki przejrzystemu, pozbawionemu zbędnych elementów wskaźnikowi
Idealny dla traderów na każdym poziomie, Niestandardowy RSI przekształca surowe dane cenowe w inteligentne, praktyczne spostrzeżenia—czyniąc go niezbędnym narzędziem do podejmowania zyskownych decyzji.
Podsumowanie
Opinie klientów
5 | 0 % | |
4 | 100 % | |
3 | 0 % | |
2 | 0 % | |
1 | 0 % |


