
LT Flexible Volume Profile
Wskaźnik
12 zakupy
Wersja 1.0, Sep 2024
Windows, Mac
5.0
Opinie: 3
Opis
Uwaga: Testowano tylko na cTrader Windows.
Profil wolumenu
Pionowy profil rysowany na wykresie cenowym, pokazujący, przy jakiej cenie jest więcej/mniej wolumenu (zainteresowania handlowego).
Wskaźnik elastycznego profilu wolumenu
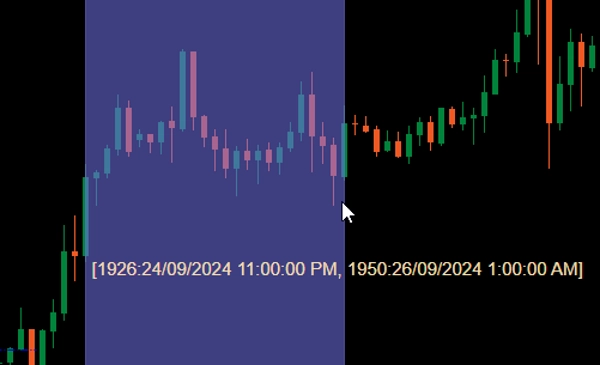
Po dodaniu do wykresu, przeciągnij lewym przyciskiem myszy z wciśniętym Ctrl na obszarze wykresu cenowego, aby narysować profil dla tego obszaru.
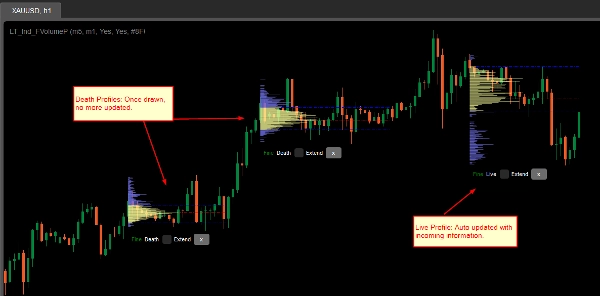
Dla wydajności profil będzie rysowany w 2 stanach:
- Profil gruby: Wskaźnik użyje ramy czasowej zdefiniowanej przez CoarseTF (domyślnie m5) do załadowania informacji o wolumenie, co zwykle jest szybkie. Podczas wyświetlania profilu grubego, profil dokładny będzie ładowany w tle.
- Profil dokładny: Bardziej precyzyjny profil, który używa ramy czasowej zdefiniowanej przez FineTF (domyślnie m1), ale można ustawić go na najdokładniejszy (t1 - pojedynczy tick). Jednak jeśli przeglądasz wykres dzienny lub dłuższy, ustawienie ramy czasowej na ticki zwiększy czas ładowania.
Parametry
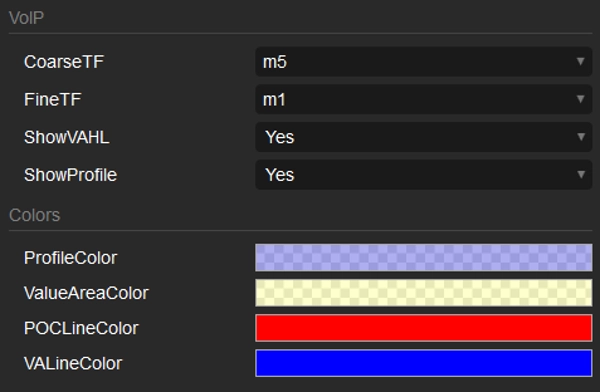
- CoarseTF: Rama czasowa dla danych grubych (domyślnie m5).
- FineTF: Rama czasowa dla danych dokładnych (domyślnie m1).
- ShowVAHL: Pokazuje VAH (Value Area High) i VAL (Value Area Low).
- ShowProfile: Jeśli Tak, pokazuje pełny profil, w przeciwnym razie pokazuje tylko VAH, VAL i POC (Point of Control).
- Colors: Dostosowanie kolorów.
Jak używać
Po dodaniu wskaźnika do wykresu cenowego, użyj przeciągnięcia lewym przyciskiem myszy z wciśniętym Ctrl, aby wybrać obszar na wykresie, który chcesz profilować i to wszystko.
Po wyrenderowaniu profilu zobaczysz kilka informacji/manipulacji na dole profilu:
- Gruby/Dokładny: status profilu.
- Martwy/Żywy: jeśli Twój profil obejmuje najnowszą świecę (słupka), jest to profil żywy i automatycznie aktualizowany o nadchodzące informacje.
- Pole wyboru Rozszerz: zaznacz, aby linie VAH, VAL i POC były przedłużone do najnowszej świecy (słupka)
- Przycisk x: Kliknij, aby usunąć profil z wykresu.
Podsumowanie
Podsumowanie AI
LT Flexible Volume Profile is a volume profile indicator designed for use on price charts, primarily tested on cTrader Windows. It visually represents trading volume distribution across price levels within a selected chart area, highlighting where trading interest is higher or lower.
Users activate the profile by holding Ctrl and dragging the mouse over a desired chart region. The indicator operates in two modes for performance optimization: a Coarse profile using a configurable timeframe (default 5 minutes) for faster loading, and a Fine profile using a finer timeframe (default 1 minute, with an option down to single ticks) for more precise volume data.
Key parameters include:
- CoarseTF and FineTF: timeframes for coarse and fine volume data aggregation.
- ShowVAHL: toggles display of Value Area High (VAH) and Value Area Low (VAL).
- ShowProfile: controls whether the full profile or only key levels (VAH, VAL, Point of Control) are shown.
- Colors: customizable color settings.
After rendering, the profile provides status indicators (Coarse/Fine, Live/Dead), options to extend VAH, VAL, and POC lines to the latest bar, and the ability to remove the profile. This tool supports detailed volume analysis to assist traders in identifying significant price levels based on traded volume.
Profil wskaźnika
Opinie klientów
5.0
Opinie: 3
5 | 100 % | |
4 | 0 % | |
3 | 0 % | |
2 | 0 % | |
1 | 0 % |
Opinie klientów
October 1, 2024
Sensible product to test around volume based context. The useful part is checking participation, value areas and pressure, with the numbers checked before scaling. I would review 20 reactions near POC or VWAP before trusting the read. The data helps most when price action confirms the same zone.
September 30, 2024
September 30, 2024
Good tool for patience if the trader wants it adds useful information behind the price move. It works best as support, not a final decision maker. Volume context is stronger when POC, VWAP and value area agree across 2 sessions. volume alone can be noisy without price action.
Dyskusja
Częste pytania
Forex
Produkty dostępne za pośrednictwem cTrader Store, w tym boty handlowe, wskaźniki i wtyczki, dostarczane są przez deweloperów zewnętrznych i udostępniane wyłącznie w celach informacyjnych oraz w celu zapewnienia dostępu technicznego. cTrader Store nie jest brokerem i nie zapewnia doradztwa inwestycyjnego, nie udziela spersonalizowanych rekomendacji ani nie gwarantuje przyszłych wyników.


Cena
Od 25/09/2024
34
Sprzedaż