
LT_SmartSwings
อินดิเคเตอร์
6 การซื้อ
เวอร์ชัน 1.0, Jun 2025
Windows, Mac
5.0
รีวิว: 1
หมายเหตุ: ทดสอบบน cTrader Windows เท่านั้น
LT_SmartSwings เป็นตัวบ่งชี้โครงสร้างตลาดแบบสวิงที่ทรงพลัง ออกแบบมาเพื่อช่วยเทรดเดอร์ในการมองเห็นจุดเปลี่ยนสำคัญ การเคลื่อนไหวของตลาด และเหตุการณ์เบรกเอาต์อย่างชัดเจนและยืดหยุ่น สร้างขึ้นเพื่อความแม่นยำและความสามารถในการปรับตัว เครื่องมือนี้เหมาะสำหรับเทรดเดอร์ที่พึ่งพาเหตุผลแบบสวิง การรวมตัวของฟีโบนักชี และการวิเคราะห์เบรกเอาต์
คุณสมบัติหลัก:
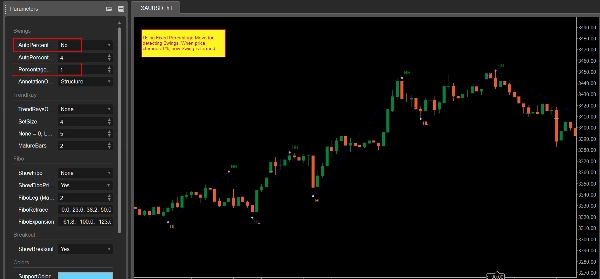
- การตรวจจับ Swing สูง/ต่ำ ตามเปอร์เซ็นต์การเคลื่อนไหวของราคา
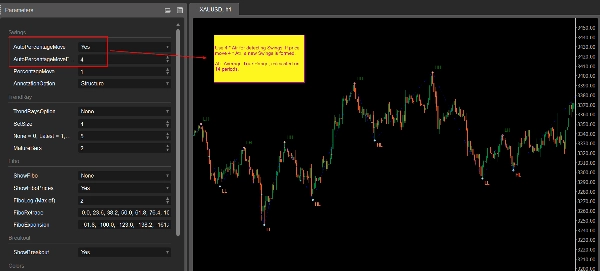
- เกณฑ์อัตโนมัติหรือด้วยตนเอง: ใช้ % คงที่หรือโหมดอัตโนมัติ (ตาม ATR x ปัจจัย)
- เส้น ZigZag เชื่อมต่อสวิงสำคัญ
- คำอธิบายรายละเอียด พร้อม 5 โหมด:
-
- โครงสร้าง: HH, HL, LH, LL
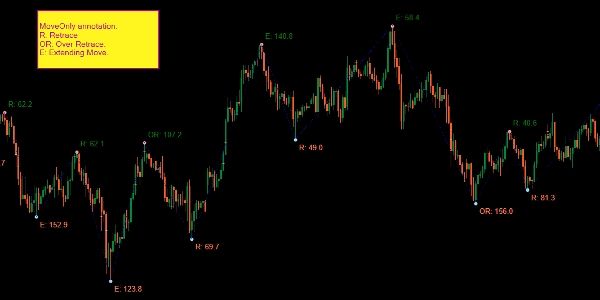
- MoveOnly: เปอร์เซ็นต์การย้อนกลับ (R) และการขยาย (E)
- PriceOnly
- MoveNPrice
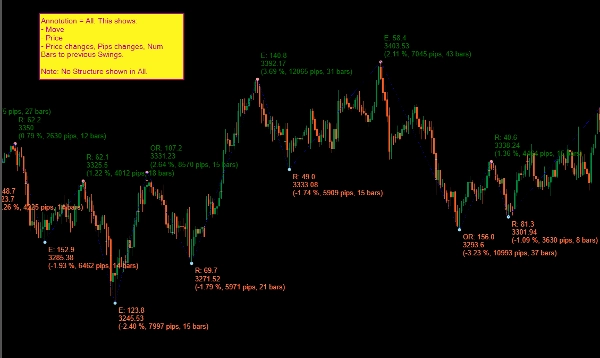
- ทั้งหมด: เปอร์เซ็นต์การเคลื่อนไหว, พิปส์, แท่ง, ราคา, ประเภทการเคลื่อนไหว
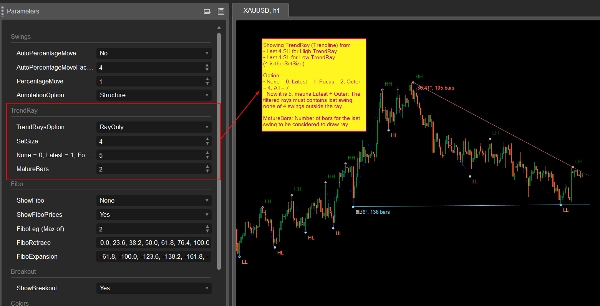
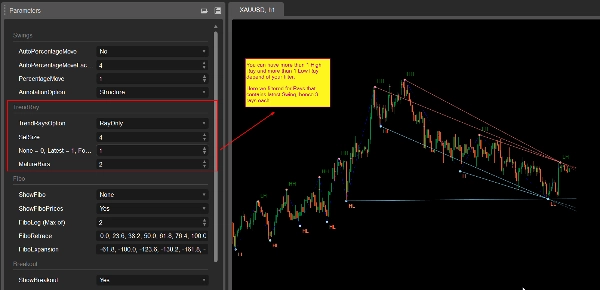
- การฉายรังสีแนวโน้ม (พร้อมตัวกรองหลายตัวเลือก):
-
- วาดรังสีจากสวิงล่าสุดโดยใช้ข้อจำกัดอัจฉริยะ
- ตัวเลือก: ล่าสุด, โฟกัส (ความชัน), ภายนอก หรือทั้งหมด
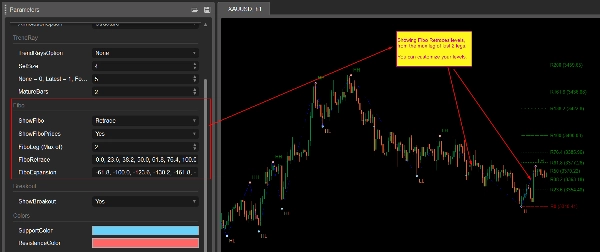
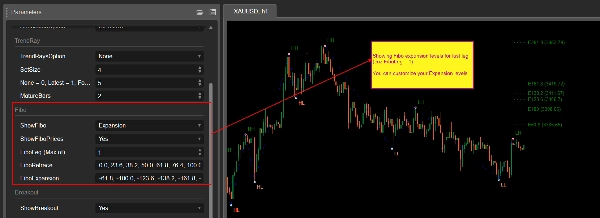
- ระดับฟีโบนักชีอัตโนมัติ:
-
- วาดระดับการย้อนกลับหรือการขยายตามการเคลื่อนไหวล่าสุด
- ชุดระดับที่ผู้ใช้กำหนดค่าได้
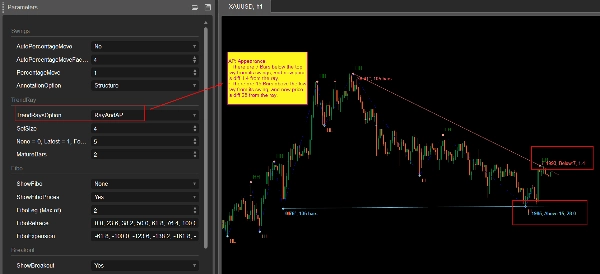
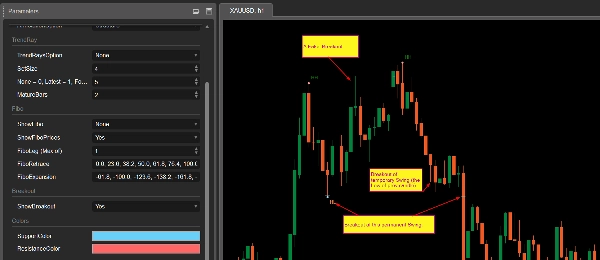
- การทำเครื่องหมายเบรกเอาต์:
-
- ตรวจจับการเบรกเอาต์ของจุดสวิง (ทั้งเบรกเอาต์ที่ยืนยันและเท็จ)
- แสดงผลอย่างต่อเนื่องเพื่ออ้างอิงประวัติ
- การปรับแต่งสี สำหรับเส้นแนวรับ/แนวต้าน
กรณีการใช้งาน:
- ระบุแนวรับ/แนวต้านแบบไดนามิก
- เข้าใจโครงสร้างสวิงและการเปลี่ยนแปลง
- สังเกตการต่อเนื่องหรือการกลับตัวของแนวโน้มโดยใช้ฟีบส์
- มองเห็นจุดเบรกเอาต์เพื่อวางแผนการเทรด
- รวมกับระบบที่มีอยู่หรือกลยุทธ์ตามดุลยพินิจของคุณ
คำแนะนำการใช้งาน:
- แนบกับกรอบเวลาที่คุณใช้งาน (เช่น M30, H1)
- เหมาะสำหรับเทรดเดอร์มือ, นักวิเคราะห์โครงสร้าง และกลยุทธ์ที่ใช้การยืนยัน
ข้อเสนอเปิดตัว: มีจำหน่ายแล้วในราคาเพียง $15!
โปรไฟล์อินดิเคเตอร์
5.0
รีวิว: 1
5 | 100 % | |
4 | 0 % | |
3 | 0 % | |
2 | 0 % | |
1 | 0 % |
Breakout
ATR
ผลิตภัณฑ์ที่มีให้บริการผ่าน cTrader Store รวมถึงบอทการเทรด อินดิเคเตอร์ และปลั๊กอิน มีให้บริการโดยนักพัฒนาบุคคลที่สามและมีไว้เพื่อวัตถุประสงค์ในการเข้าถึงข้อมูลและทางเทคนิคเท่านั้น cTrader Store ไม่ใช่โบรกเกอร์และไม่ได้ให้คำแนะนำการลงทุน คำแนะนำส่วนบุคคล หรือการรับประกันผลการดำเนินงานในอนาคต


ตั้งแต่ 25/09/2024
34
การขาย