
Supertrend - Multi-Timeframe
Wskaźnik
1 zakupy
Wersja 1.0, Oct 2025
Windows, Mac
4.5
Opinie: 2
Opis
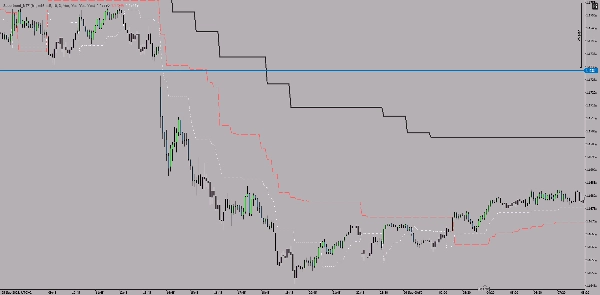
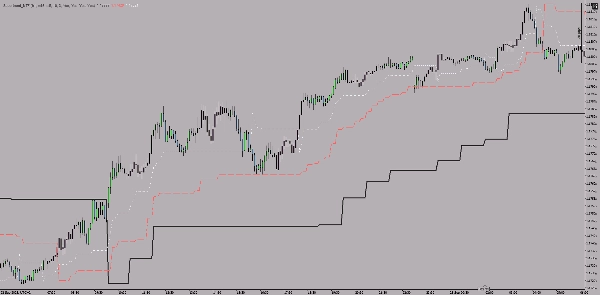
Jest to wskaźnik Multi-TimeFrame Supertrend dla platformy cTrader, który wyświetla linie Supertrend z trzech różnych ram czasowych jednocześnie na jednym wykresie.
Kluczowe cechy
Wyświetlanie trzech równoległych ram czasowych:
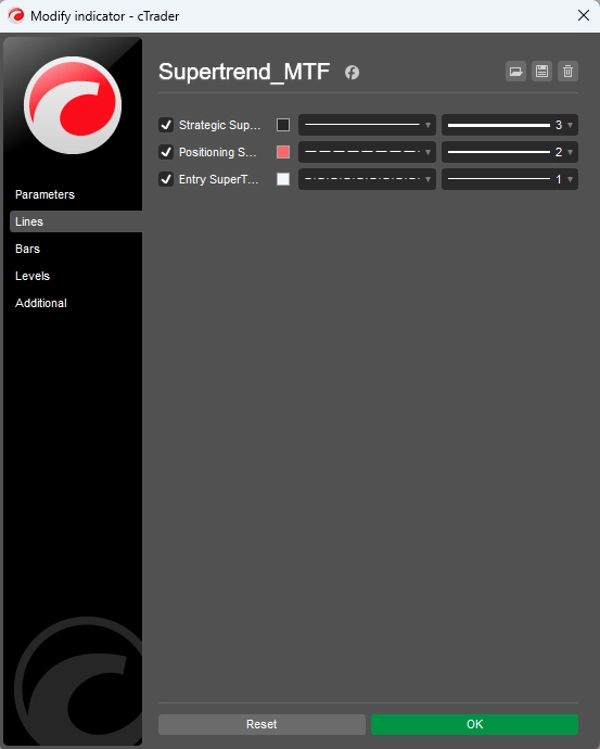
- Strategiczna ramka czasowa (domyślnie: 1 godzina) - gruba, ciągła linia
- Ramka czasowa pozycji (domyślnie: 15 minut) - średnia grubość, linia przerywana
- Ramka czasowa wejścia (domyślnie: 5 minut) - cienka, kropkowana linia
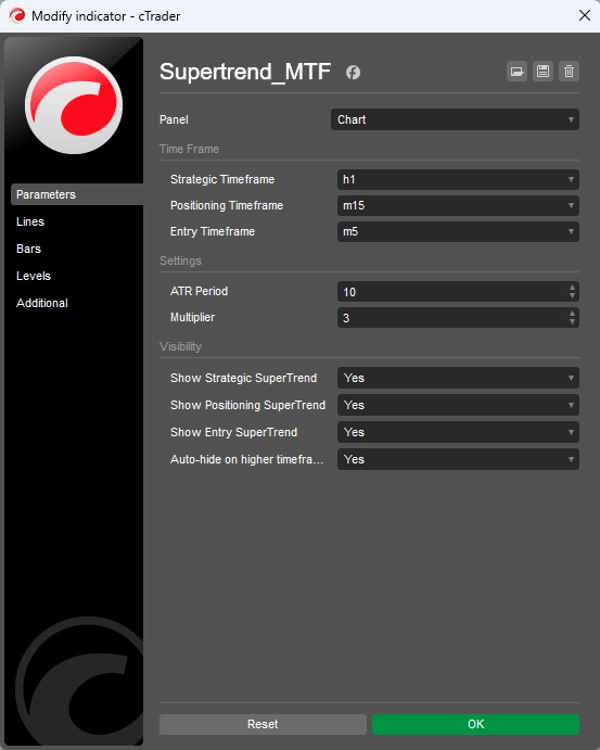
Konfigurowalne ustawienia:
- Okres ATR (domyślnie: 10)
- Mnożnik (domyślnie: 3.0)
- Każda z trzech ramek czasowych może być indywidualnie włączana/wyłączana
- Automatyczne ukrywanie na wyższych ramach czasowych (opcjonalne)
Jak to działa
Wskaźnik wykorzystuje klasyczną logikę Supertrend dla wszystkich trzech ramek czasowych, gdzie:
- Trend jest wzrostowy, gdy cena znajduje się powyżej linii Supertrend
- Trend jest spadkowy, gdy cena znajduje się poniżej linii Supertrend
- Różne grubości i style linii pomagają odróżnić ramki czasowe
Cel
Pomaga w analizie wieloramkowej: większa ramka czasowa dostarcza główny kierunek (strategię), środkowa precyzuje pozycjonowanie, a najmniejsza oznacza konkretne punkty wejścia.
Podsumowanie
Podsumowanie AI
The Supertrend - Multi-Timeframe Indicator for the cTrader platform displays Supertrend lines from three distinct timeframes simultaneously on a single chart. It features a strategic timeframe (default 1 hour) shown as a thick solid line, a positioning timeframe (default 15 minutes) as a medium dashed line, and an entry timeframe (default 5 minutes) as a thin dotted line. Each timeframe can be individually enabled or disabled, with customizable settings including ATR period and multiplier. The indicator applies classic Supertrend logic: the trend is considered up when the price is above the Supertrend line and down when below. Different line styles and thicknesses visually distinguish the timeframes. This tool supports multi-timeframe analysis by providing the main directional trend from the larger timeframe, refined positioning from the middle timeframe, and specific entry points from the smallest timeframe. It is applicable across various markets including Forex, indices, commodities, stocks, and cryptocurrencies, and supports symbols such as BTCUSD, EURUSD, GBPUSD, XAUUSD, NAS100, and USDJPY.
Profil wskaźnika
Opinie klientów
4.5
Opinie: 2
5 | 50 % | |
4 | 50 % | |
3 | 0 % | |
2 | 0 % | |
1 | 0 % |
Opinie klientów
October 13, 2025
The part worth keeping is the setup needs a cleaner reason to exist, and a few ugly trades are useful in the sample.
October 10, 2025
Dyskusja
Częste pytania
BTCUSD
Forex
Breakout
Indices
EURUSD
Commodities
GBPUSD
NZDUSD
Prop
Scalping
Crypto
Stocks
XAUUSD
NAS100
USDJPY
Produkty dostępne za pośrednictwem cTrader Store, w tym boty handlowe, wskaźniki i wtyczki, dostarczane są przez deweloperów zewnętrznych i udostępniane wyłącznie w celach informacyjnych oraz w celu zapewnienia dostępu technicznego. cTrader Store nie jest brokerem i nie zapewnia doradztwa inwestycyjnego, nie udziela spersonalizowanych rekomendacji ani nie gwarantuje przyszłych wyników.


![Logo „[Hamster-Coder] Bollinger Bands”](https://cdn.ctrader.com/image/webp/21d8e5d6-fb11-4bac-b9ee-cd05c2b76804_30327)


Cena
Od 05/01/2025
14
Sprzedaż