
PivotLevels
Wskaźnik
1 zakupy
Wersja 1.0, Sep 2025
Windows, Mac
4.5
Opinie: 2
Opis
Wskaźnik Punktów Zwrotnych
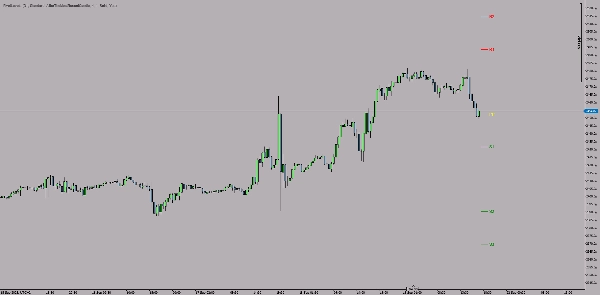
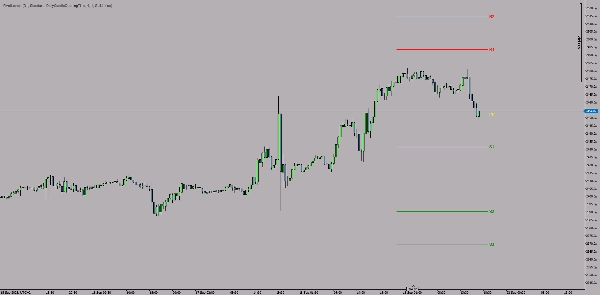
Punkty Zwrotne to wskaźnik techniczny dla platformy cTrader, który automatycznie oblicza i wyświetla punkty zwrotne jako linie trendu na wykresie.
Kluczowe cechy:
🎯 Typy punktów zwrotnych:
- Standardowe punkty zwrotne
- Punkty zwrotne Fibonacciego
- Punkty zwrotne Woodiego
- Punkty zwrotne Camarilla
📊 Poziomy:
- Centralny punkt zwrotny (PP) - żółty
- Poziomy oporu (R1, R2, R3) - czerwony
- Poziomy wsparcia (S1, S2, S3) - zielony
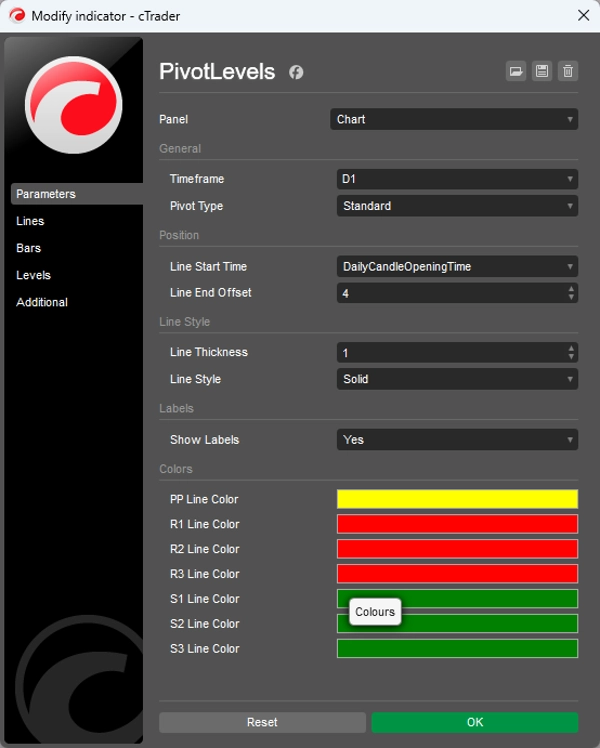
⚙️ Ustawienia konfigurowalne:
- Interwał czasowy: Wybór dzienny, tygodniowy lub inny
- Styl linii: Grubość (1-5) i typ (ciągła, przerywana itp.)
- Pozycjonowanie: Czas rozpoczęcia i długość linii
- Kolory: Indywidualna regulacja koloru każdego poziomu
- Etykiety: Włączanie/wyłączanie tekstowych etykiet
💡 Zastosowanie:
Wskaźnik oblicza poziomy punktów zwrotnych na podstawie wartości maksymalnych, minimalnych, zamknięcia (i otwarcia) z poprzedniego okresu (dnia/tygodnia), które identyfikują kluczowe obszary wsparcia i oporu na następny okres handlowy.
Idealny dla traderów swingowych i dziennych stosujących strategie oparte na poziomach technicznych.
Podsumowanie
Podsumowanie AI
PivotLevels is a technical indicator for the cTrader platform that automatically calculates and displays pivot points as trendlines on trading charts. It supports multiple pivot point calculation methods, including Standard, Fibonacci, Woodie, and Camarilla pivots. The indicator plots key levels such as the Central Pivot Point (PP) in yellow, resistance levels (R1, R2, R3) in red, and support levels (S1, S2, S3) in green.
Users can customize various settings, including the timeframe for pivot calculation (daily, weekly, or others), line style (thickness and type), line positioning (start time and length), colors for each level, and the option to toggle text labels on or off. The pivot levels are derived from the previous period’s high, low, close, and open prices, helping identify potential support and resistance zones for the upcoming trading period.
This indicator is suitable for traders who use technical levels in their strategies, particularly swing and day traders. It supports multiple markets such as forex, indices, commodities, cryptocurrencies, and stocks.
Profil wskaźnika
Opinie klientów
4.5
Opinie: 2
5 | 50 % | |
4 | 50 % | |
3 | 0 % | |
2 | 0 % | |
1 | 0 % |
Opinie klientów
September 30, 2025
The review gets easier when the decision feels less rushed, and The setup needs patience.
Dyskusja
Częste pytania
Prop
Forex
Indices
Commodities
Crypto
Stocks
Produkty dostępne za pośrednictwem cTrader Store, w tym boty handlowe, wskaźniki i wtyczki, dostarczane są przez deweloperów zewnętrznych i udostępniane wyłącznie w celach informacyjnych oraz w celu zapewnienia dostępu technicznego. cTrader Store nie jest brokerem i nie zapewnia doradztwa inwestycyjnego, nie udziela spersonalizowanych rekomendacji ani nie gwarantuje przyszłych wyników.


Cena
Od 05/01/2025
14
Sprzedaż