
설명
이것은 cTrader 플랫폼용 다중 타임프레임 슈퍼트렌드 지표로, 세 가지 다른 타임프레임의 슈퍼트렌드 라인을 단일 차트에 동시에 표시합니다.
주요 특징
세 개의 병렬 타임프레임 표시:
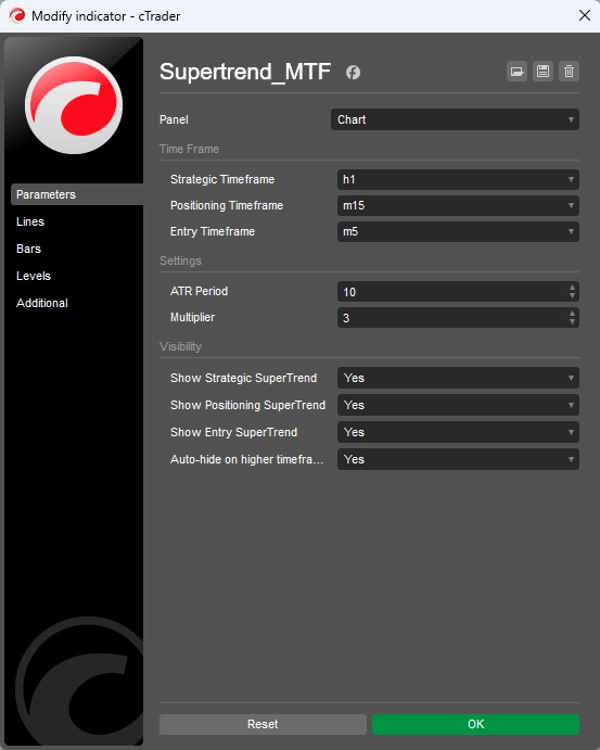
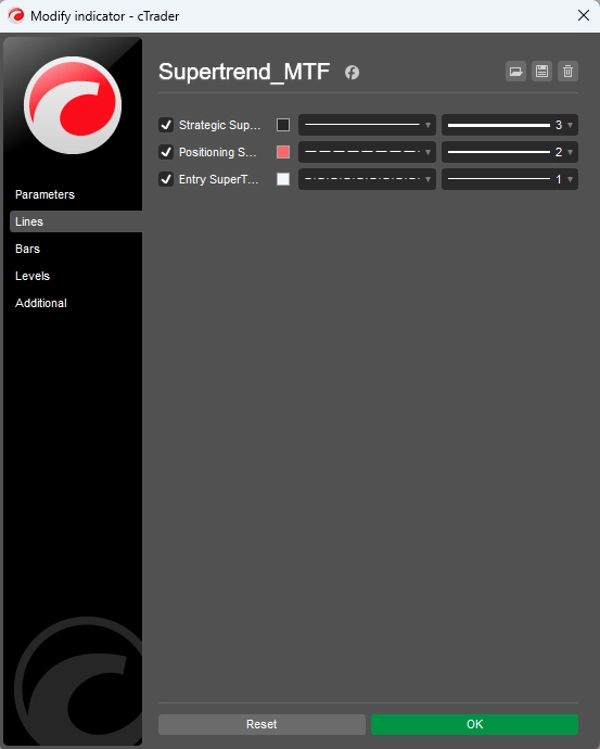
- 전략 타임프레임 (기본값: 1시간) - 두껍고 실선
- 포지셔닝 타임프레임 (기본값: 15분) - 중간 두께, 점선
- 진입 타임프레임 (기본값: 5분) - 얇고 점선
사용자 설정 가능:
- ATR 기간 (기본값: 10)
- 배수 (기본값: 3.0)
- 세 개의 타임프레임 각각을 개별적으로 활성화/비활성화 가능
- 상위 타임프레임에서 자동 숨김 (선택 사항)
작동 원리
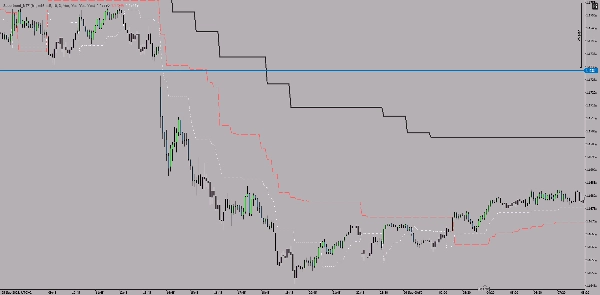
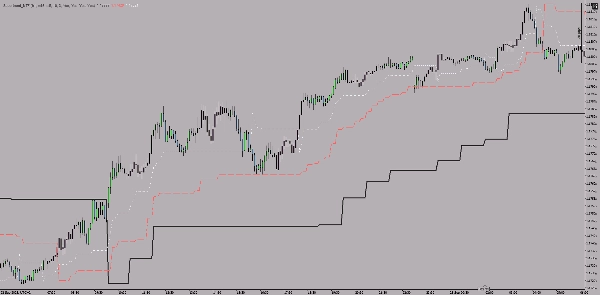
이 지표는 세 가지 타임프레임 모두에 대해 고전적인 슈퍼트렌드 논리를 사용하며, 다음과 같습니다:
- 가격이 슈퍼트렌드 라인 위에 있을 때 추세는 상승
- 가격이 슈퍼트렌드 라인 아래에 있을 때 추세는 하락
- 다른 라인 두께와 스타일로 타임프레임을 구분
목적
다중 타임프레임 분석 지원: 더 큰 타임프레임은 주요 방향(전략)을 제공하고, 중간 타임프레임은 포지셔닝을 세밀하게 조정하며, 가장 작은 타임프레임은 구체적인 진입 지점을 표시합니다.
요약
AI 요약
The Supertrend - Multi-Timeframe Indicator for the cTrader platform displays Supertrend lines from three distinct timeframes simultaneously on a single chart. It features a strategic timeframe (default 1 hour) shown as a thick solid line, a positioning timeframe (default 15 minutes) as a medium dashed line, and an entry timeframe (default 5 minutes) as a thin dotted line. Each timeframe can be individually enabled or disabled, with customizable settings including ATR period and multiplier. The indicator applies classic Supertrend logic: the trend is considered up when the price is above the Supertrend line and down when below. Different line styles and thicknesses visually distinguish the timeframes. This tool supports multi-timeframe analysis by providing the main directional trend from the larger timeframe, refined positioning from the middle timeframe, and specific entry points from the smallest timeframe. It is applicable across various markets including Forex, indices, commodities, stocks, and cryptocurrencies, and supports symbols such as BTCUSD, EURUSD, GBPUSD, XAUUSD, NAS100, and USDJPY.
지표 프로필
고객 리뷰
4.5
리뷰: 2
5 | 50 % | |
4 | 50 % | |
3 | 0 % | |
2 | 0 % | |
1 | 0 % |
고객 리뷰
October 13, 2025
The part worth keeping is the setup needs a cleaner reason to exist, and a few ugly trades are useful in the sample.
October 10, 2025
상담
자주 묻는 질문(FAQ)
BTCUSD
Forex
Breakout
Indices
EURUSD
Commodities
GBPUSD
NZDUSD
Prop
Scalping
Crypto
Stocks
XAUUSD
NAS100
USDJPY
트레이딩 봇, 지표, 플러그인 등 cTrader Store에서 제공되는 상품은 제3자 개발자에 의해 제공되며, 이는 단순히 정보 및 기술적 접근을 목적으로 제공된 것입니다. cTrader Store는 중개인이 아니며, 투자 조언, 개인별 추천 또는 향후 성과에 대한 어떠한 보장도 제공하지 않습니다.


가격
가입일 05/01/2025
14
판매