
설명
거래 전략에서 일간 및 주간 OHLC 및 중간 가격에 의존하고 계신가요? 거래할 때마다 수동으로 표시하는 데 지치셨나요?
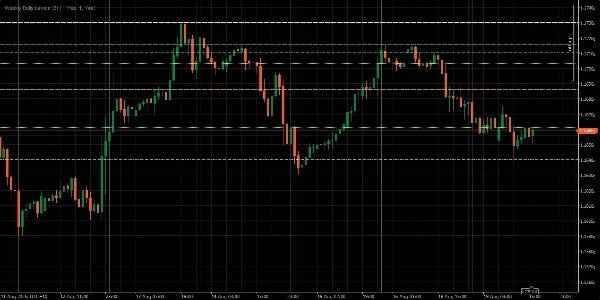
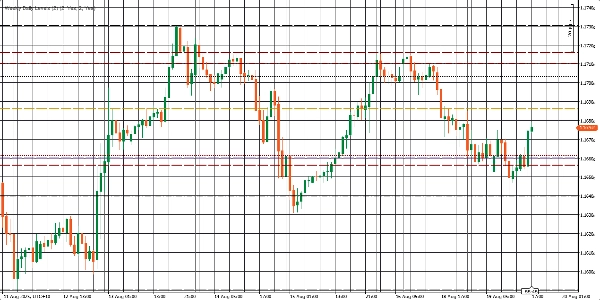
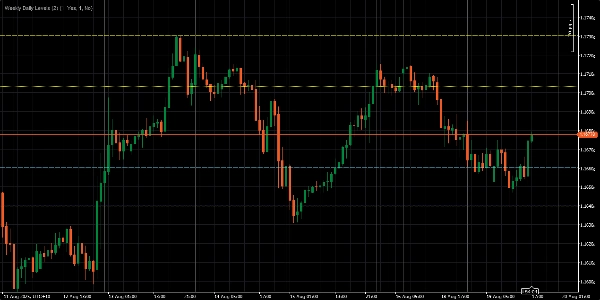
이 Weekly Daily Levels Indicator는 귀하를 위해 무거운 작업을 처리합니다. 이전 일과 이전 주의 시가, 고가, 저가, 종가(OHLC) 및 중간 가격을 차트에 자동으로 표시합니다. 이는 지표가 세부 사항을 처리하는 동안 전략 실행에 집중할 수 있음을 의미하며, 거래를 더 간단하고 빠르며 훨씬 효율적으로 만듭니다.
주요 기능:
- 일간 및 주간 OHLC 및 중간 가격을 즉시 표시합니다.
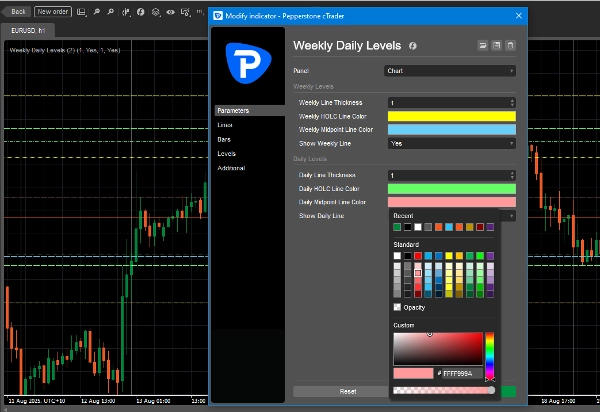
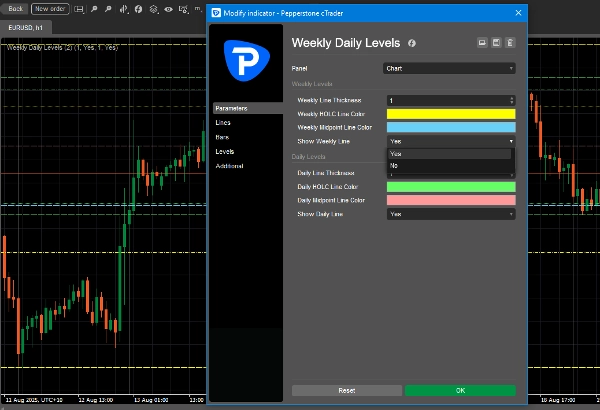
- 차트 스타일에 맞게 선 색상을 사용자 지정할 수 있습니다.
- 일간 또는 주간 레벨을 한 번의 클릭으로 켜거나 끌 수 있습니다.
- 더 나은 가시성을 위해 선 두께를 조절할 수 있습니다.
요약
AI 요약
The Weekly Daily Levels indicator automatically plots the previous day’s and previous week’s open, high, low, close (OHLC) prices along with their mid-points directly on trading charts. It provides instant visual reference to these key price levels, helping traders incorporate daily and weekly price data into their strategies without manual marking. Users can customize line colors and thickness to fit their chart style and toggle daily or weekly levels on or off with a single click. This indicator streamlines the process of tracking important historical price levels for improved trading efficiency.
지표 프로필
고객 리뷰
5.0
리뷰: 2
5 | 100 % | |
4 | 0 % | |
3 | 0 % | |
2 | 0 % | |
1 | 0 % |
고객 리뷰
August 28, 2025
Not bad if the rules are already clear. Two timeframes give more context.
August 21, 2025
the good surprise is the setup needs less second guessing, and It works better with a written plan.
상담
자주 묻는 질문(FAQ)
트레이딩 봇, 지표, 플러그인 등 cTrader Store에서 제공되는 상품은 제3자 개발자에 의해 제공되며, 이는 단순히 정보 및 기술적 접근을 목적으로 제공된 것입니다. cTrader Store는 중개인이 아니며, 투자 조언, 개인별 추천 또는 향후 성과에 대한 어떠한 보장도 제공하지 않습니다.


!["[Hamster-Coder] Pivot Points MTF" 로고](https://cdn.ctrader.com/image/webp/4c143e5a-309c-40e3-a578-f04d1e133ffa_31159)


가격
가입일 19/04/2025
2
판매