
설명
The Pro Heikin Ashi Visual Overlay 는 표준 캔들스틱 또는 바 차트를 유지하면서 Heikin Ashi 캔들의 추세 부드럽게 하는 이점을 원하는 트레이더에게 완벽한 도구입니다.
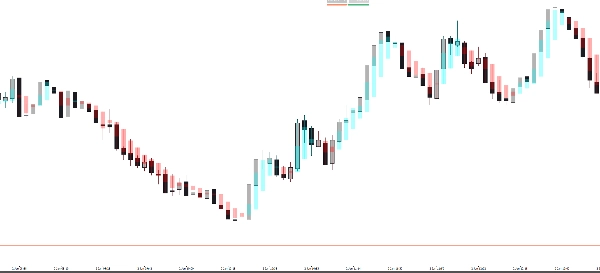
전통적인 Heikin Ashi 차트는 전체 차트 유형을 전환해야 하므로 정확한 가격 움직임을 보기 어렵습니다. 이 지표는 Heikin Ashi 캔들을 반투명 오버레이로 그려 실제 가격을 놓치지 않고도 추세 반전과 시장 모멘텀을 즉시 파악할 수 있게 합니다.
왜 이 오버레이를 사용해야 하나요?
- 💎 노이즈 감소: Heikin Ashi는 시장 노이즈를 걸러내어 승리하는 거래에 머무르기 쉽게 만듭니다.
- 🕯️ 이중 차트 보기: 표준 캔들로 가격 움직임/패턴을 유지하면서 HA 오버레이로 추세 방향을 확인하세요.
- 🎨 완전한 사용자 정의 가능: 불투명도와 색상을 작업 공간(다크 또는 라이트 모드)에 맞게 조정하세요.
- 🚀 즉각적인 추세 식별: 파란색(강세)과 빨간색(약세) 영역이 모멘텀에 역행하는 거래를 피하도록 도와줍니다.
주요 특징:
- 스마트 투명도: 오버레이가 주요 가격 움직임을 가리지 않도록 불투명도를 설정하세요.
- 완벽한 정렬: 현재 시간대의 Heikin Ashi 값에 맞게 실시간으로 계산됩니다.
- 전문적인 디자인: 차트를 복잡하게 하지 않는 깔끔한 시각 효과.
- 범용성: 모든 시간대(M1부터 월간까지)와 모든 자산(외환, 주식, 암호화폐, 지수)에 작동합니다.
사용 방법:
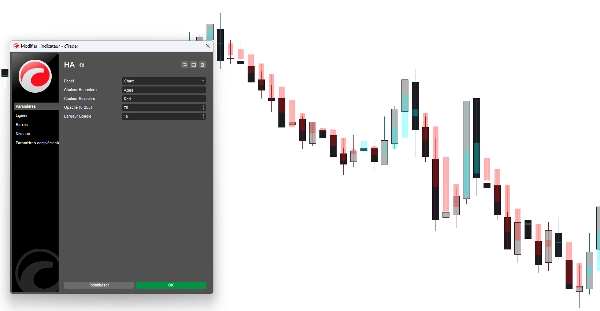
- 지표를 차트에 적용하세요.
- 설정에서 불투명도와 몸통 너비를 원하는 대로 조정하세요.
- HA 캔들로 추세 강도를 확인하세요:
-
- 추세 방향으로 긴 꼬리 = 강한 모멘텀.
- 양쪽에 꼬리가 있는 작은 몸통 = 잠재적 반전.
매개변수:
- 강세 색상: 상승 HA 캔들에 대한 사용자 지정 색상.
- 약세 색상: 하락 HA 캔들에 대한 사용자 지정 색상.
- 불투명도 (0-255): 캔들이 얼마나 "유령처럼" 또는 견고하게 보일지 조절합니다.
- 캔들 너비: 확대 수준에 완벽하게 맞도록 HA 캔들의 두께를 조정하세요.
요약
AI 요약
The Pro Heikin Ashi Visual Overlay is an indicator designed to enhance trend analysis by overlaying Heikin Ashi candles on standard candlestick or bar charts. Unlike traditional Heikin Ashi charts that replace the entire chart type, this tool provides a semi-transparent overlay, allowing traders to observe smoothed trend signals while retaining visibility of actual price action.
Key features include noise reduction to filter market fluctuations, customizable opacity and colors for integration with different chart backgrounds, and real-time alignment with the current timeframe’s Heikin Ashi calculations. The overlay uses blue and red zones to indicate bullish and bearish trends, aiding in immediate trend identification. It supports all timeframes from one minute to monthly and is compatible with various asset classes including Forex, stocks, cryptocurrencies, commodities, and indices.
Users can adjust candle width and opacity to suit their chart zoom level and visual preferences. The indicator facilitates dual-chart viewing, enabling simultaneous analysis of precise price patterns and smoothed trend momentum. It is designed with clean visuals to avoid chart clutter and supports professional trading environments.
지표 프로필
고객 리뷰
4.0
리뷰: 1
5 | 0 % | |
4 | 100 % | |
3 | 0 % | |
2 | 0 % | |
1 | 0 % |
상담
자주 묻는 질문(FAQ)
Forex
Signal
Indices
Commodities
Crypto
Stocks
트레이딩 봇, 지표, 플러그인 등 cTrader Store에서 제공되는 상품은 제3자 개발자에 의해 제공되며, 이는 단순히 정보 및 기술적 접근을 목적으로 제공된 것입니다. cTrader Store는 중개인이 아니며, 투자 조언, 개인별 추천 또는 향후 성과에 대한 어떠한 보장도 제공하지 않습니다.
이 작성자의 상품 더 보기


가격
가입일 27/10/2025
10
판매