
설명
"역공학" 개념
이 지표의 주요 혁신은 역공학 알고리즘에 있습니다. 일반적으로 스토캐스틱 오실레이터는 가격 데이터를 받아 0에서 100 사이의 숫자로 변환합니다. 이 지표는 그 반대로 작동합니다: 오실레이터의 수학적 수준을 받아 가격 척도에 다시 투영합니다.
이를 통해 트레이더는 수학적 모멘텀을 차트 상에서 직접적인 구체적인 가격 수준($ 또는 핍)으로 변환할 수 있습니다.
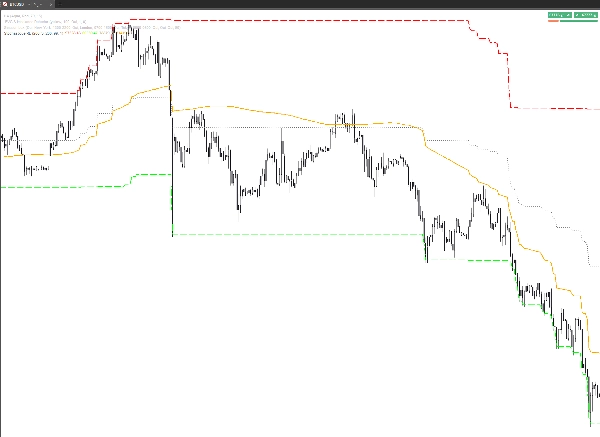
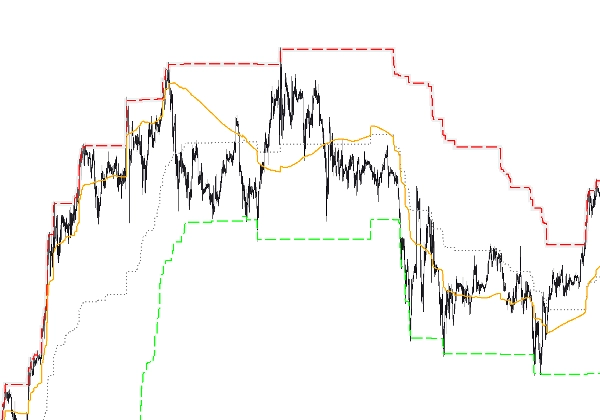
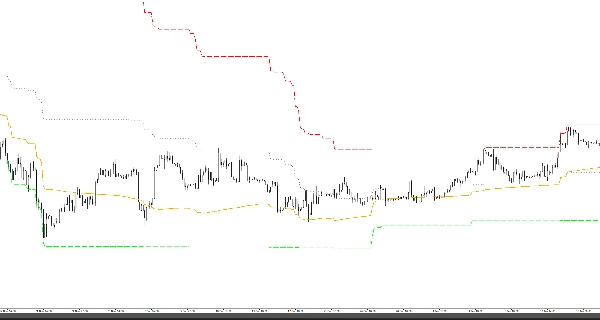
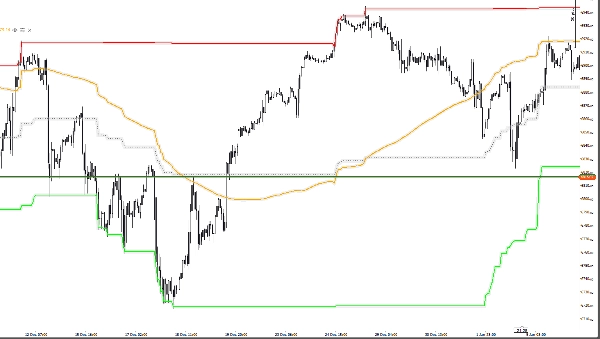
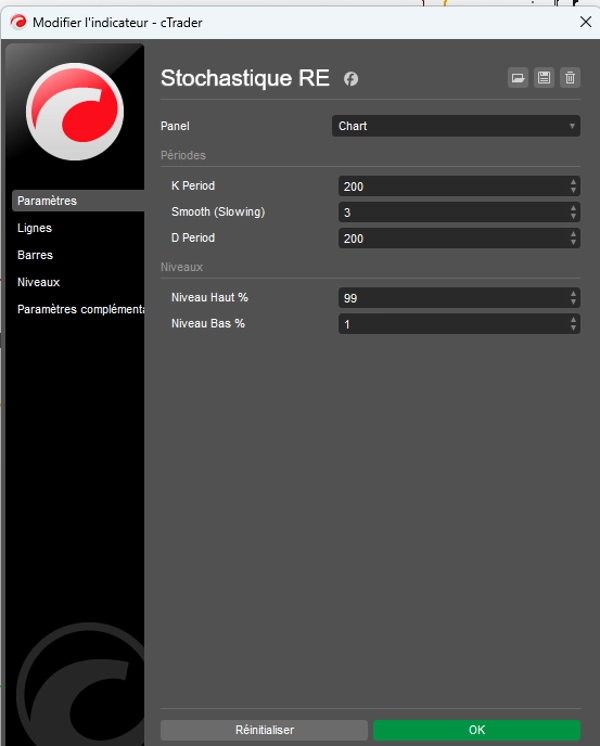
경계 정의: 천장(99%)과 바닥(1%)
기존 설정(80/20)과 달리, 이 지표는 기본값으로 1%와 99%로 설정되어 있습니다. 이 구성은 특정 목적을 가지고 있습니다: 가격의 물리적 한계를 정의합니다.
- 99% 수준 (가격 천장): 주어진 기간 동안 시장이 이동 진폭의 99%를 소진했다고 간주되기 전 도달할 수 있는 최고 가격을 정의합니다. 이는 가격의 "경계"입니다.
- 1% 수준 (가격 바닥): 현재 사이클의 궁극적인 지지선인 최저 가격을 정의합니다. 이는 가격이 최근 이력에 비해 하락 능력의 99%를 소진한 수준입니다.
왜 "가격을 정의"하는가?
이 시스템 덕분에 오렌지 신호 %D 선은 더 이상 진공 상태에서 움직이는 곡선이 아닙니다.
- 가격 위치 지정: 모멘텀에 가중된 "공정 가격"의 정확한 위치를 보여줍니다.
- 범위 매핑: 현재 가격이 잠재력의 1%인지 99%인지 볼 수 있는 지도로 차트를 변환합니다.
- 구체적인 목표: 오렌지 선이 상승하면 단순히 "80"에 도달하려는 것이 아니라 빨간 선(99%)이 표시하는 정확한 가격에 도달하려는 것입니다.
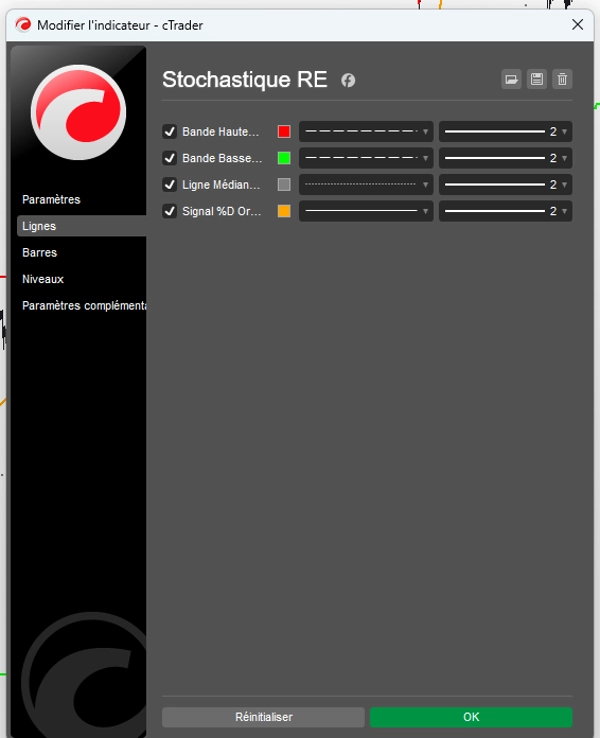
선 기능 (Lines 탭)
즉각적인 시각적 판독을 위해 모든 것이 사용자 정의 가능합니다:
- 상단 밴드 (99%): 이론적인 가격 천장.
- 하단 밴드 (1%): 이론적인 가격 바닥.
- 중앙선 (50%): 중심 피벗 포인트, 균형 영역.
- 오렌지 신호 %D: 시장 방향을 정의하기 위해 바닥과 천장 사이를 탐색하는 동적 커서.
트레이더 요약
이 지표는 단순히 시장이 "과매수" 상태임을 알려주는 것이 아니라 정확히 어떤 가격에서 시장이 물리적으로 너무 비싸지거나(99%) 너무 싸지다는(1%) 것을 보여줍니다. 이는 수학을 주문서의 현실로 되돌리는 정밀 도구입니다.
요약
AI 요약
Stochastique RE is an indicator that applies a reverse engineering algorithm to the stochastic oscillator concept. Instead of converting price data into a stochastic value between 0 and 100, it projects stochastic levels (1% to 99%) back onto the price scale. This approach defines concrete market boundaries by identifying a price ceiling (99%) and a price floor (1%), representing the physical limits of price movement over a given period.
The indicator displays these boundaries directly on the price chart, allowing traders to see exact price levels where the market is considered overbought or oversold. Key features include customizable lines for the upper band (99%), lower band (1%), mid line (50%), and an orange signal %D line that dynamically indicates market direction between these boundaries.
By translating momentum into precise price targets, Stochastique RE helps traders localize fair price zones, map price ranges, and identify concrete price targets rather than abstract oscillator values. It supports various markets including Forex, stocks, commodities, indices, and cryptocurrencies, with symbol tags such as BTCUSD, EURUSD, GBPUSD, XAUUSD, NAS100, and USDJPY.
지표 프로필
고객 리뷰
4.6
리뷰: 3
5 | 67 % | |
4 | 33 % | |
3 | 0 % | |
2 | 0 % | |
1 | 0 % |
고객 리뷰
February 28, 2026
helps more when the trader avoids forced trades. Half size is enough at the start.
February 18, 2026
Solid enough as a backup opinion. Two sessions say more than one clean chart.
상담
자주 묻는 질문(FAQ)
BTCUSD
Forex
Breakout
Indices
EURUSD
Commodities
GBPUSD
NZDUSD
Crypto
Stocks
XAUUSD
NAS100
USDJPY
트레이딩 봇, 지표, 플러그인 등 cTrader Store에서 제공되는 상품은 제3자 개발자에 의해 제공되며, 이는 단순히 정보 및 기술적 접근을 목적으로 제공된 것입니다. cTrader Store는 중개인이 아니며, 투자 조언, 개인별 추천 또는 향후 성과에 대한 어떠한 보장도 제공하지 않습니다.
이 작성자의 상품 더 보기


가격
가입일 27/10/2025
10
판매