

설명
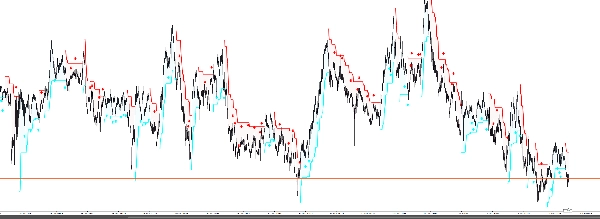
시장을 거래하려면 두 가지가 필요합니다: 추세를 식별하고 진입할 적절한 순간을 찾는 것. Auto Signal BUY SELL 은 이 두 가지를 자동으로 수행하며, cTrader 차트에 명확하고 실행 가능한 신호를 직접 제공합니다.
이 지표는 단순한 화살표 도구가 아니라, 시장 소음을 제거하고 가장 신뢰할 수 있는 설정만을 강조하도록 설계된 정교한 하이브리드 시스템입니다.
논리 작동 방식:
모든 교차점에서 신호를 보내는 기본 지표와 달리, Auto Signal BUY SELL 은 엄격한 이중 확인 엔진을 사용합니다:
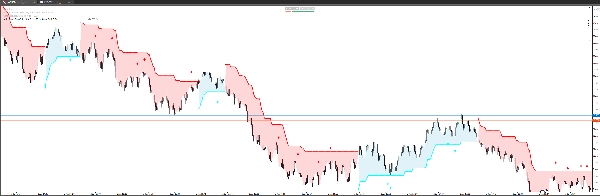
- 추세 필터 (SuperTrend Cloud): 지표는 장기 추세를 분석합니다. 시장이 강세인지 약세인지 즉시 알려주는 동적인 시각적 "클라우드"를 생성합니다.
- 정밀 트리거 (Zero-Lag MACD): 제로 지연 기술이 적용된 맞춤형 MACD를 사용합니다. 이를 통해 표준 MACD보다 훨씬 빠르게 모멘텀 변화를 감지하고 "저점 매수" 기회를 포착할 수 있습니다.
주요 특징:
- 🎯 고정확도 화살표: 추세와 모멘텀이 완벽하게 일치할 때만 매수/매도 신호가 나타납니다.
- ☁️ 동적 추세 클라우드: 시장 방향을 올바르게 유지하도록 돕는 아름답고 반투명한 배경 채우기입니다.
- 🚀 제로 지연 계산: 이동 중 더 빠른 신호를 받아 더 나은 위험 대비 보상 비율을 제공합니다.
- 🎨 완전 맞춤형 UI: 전문가용 드롭다운 메뉴를 사용하여 화살표 색상, 클라우드 불투명도, 신호 민감도를 변경할 수 있습니다.
- 📏 스마트 오프셋: 화살표가 캔들에서 너무 가까워지지 않도록 거리를 조절하여 시야를 방해하지 않습니다.
Auto Signal BUY SELL로 거래하는 방법:
- 파란 화살표 (매수): 추세가 강세이고 MACD가 과매도 구간에서 강한 모멘텀 회복을 신호할 때 나타납니다.
- 빨간 화살표 (매도): 추세가 약세이고 MACD가 과매수 구간에서 강한 모멘텀 반전을 신호할 때 나타납니다.
이 지표를 선택해야 하는 이유?
기본 지표는 종종 지연되어 움직임이 끝난 후에 진입하게 만듭니다. Auto Signal BUY SELL 은 속도와 명확성을 최적화했습니다. 스캘퍼, 데이 트레이더, 그리고 더 깔끔하고 전문적인 차트를 원하는 스윙 트레이더에게 완벽한 동반자입니다.
요약
AI summary
Auto Signal BUY SELL is a professional trading indicator designed for the cTrader platform to assist traders in identifying market trends and optimal entry points. It combines two core components: a Trend Filter using a SuperTrend Cloud to visually indicate bullish or bearish market phases, and a Precision Trigger based on a custom zero-lag MACD to detect momentum shifts rapidly. This dual-confirmation system aims to reduce market noise and generate high-probability buy and sell signals.
Key features include high-accuracy arrows that appear only when trend and momentum align, a dynamic semi-transparent trend cloud for clear market direction, zero-lag calculations for earlier signals, and a fully customizable user interface allowing adjustments to arrow colors, cloud opacity, and signal sensitivity. Smart offsets help maintain chart clarity by positioning arrows away from candlesticks.
Trading signals are indicated by blue arrows for buy opportunities during bullish trends with momentum recovery, and red arrows for sell opportunities during bearish trends with momentum reversal. The indicator supports various markets including Forex, indices, commodities, and cryptocurrencies. It is suitable for scalpers, day traders, and swing traders seeking a clearer, faster decision-making tool.
Key features include high-accuracy arrows that appear only when trend and momentum align, a dynamic semi-transparent trend cloud for clear market direction, zero-lag calculations for earlier signals, and a fully customizable user interface allowing adjustments to arrow colors, cloud opacity, and signal sensitivity. Smart offsets help maintain chart clarity by positioning arrows away from candlesticks.
Trading signals are indicated by blue arrows for buy opportunities during bullish trends with momentum recovery, and red arrows for sell opportunities during bearish trends with momentum reversal. The indicator supports various markets including Forex, indices, commodities, and cryptocurrencies. It is suitable for scalpers, day traders, and swing traders seeking a clearer, faster decision-making tool.
지표 프로필
고객 리뷰
4.3
리뷰: 3
5 | 33 % | |
4 | 67 % | |
3 | 0 % | |
2 | 0 % | |
1 | 0 % |
고객 리뷰
January 13, 2026
January 6, 2026
It is not flashy, but the signal gets compared with context. Risk still needs respect.
상담
자주 묻는 질문(FAQ)
Forex
Signal
Indices
Supertrend
Commodities
Crypto
XAUUSD
MACD
트레이딩 봇, 지표, 플러그인 등 cTrader Store에서 제공되는 상품은 제3자 개발자에 의해 제공되며, 이는 단순히 정보 및 기술적 접근을 목적으로 제공된 것입니다. cTrader Store는 중개인이 아니며, 투자 조언, 개인별 추천 또는 향후 성과에 대한 어떠한 보장도 제공하지 않습니다.























가격
가입일 27/10/2025
15
판매